

Construction Cost Insights Report: Q2 2024

Executive Summary
As the construction industry navigates the second quarter of 2024, this report offers a comprehensive analysis of construction material pricing trends. Drawing on insights from industry leaders at Gordian, STO Building Group and Ryan Companies, we illuminate the dynamic landscape of challenges and opportunities shaping the sector. Despite overall stability, the industry experiences nuanced fluctuations, highlighting the importance of adaptability and resilience.
Gordian’s data-driven forecasts, complemented by STO Building Group’s supply-side insights and Ryan Companies’ innovative strategies, provide industry leaders a reliable compass for effectively navigating uncertainty. From sector-specific shifts to labor market dynamics and global influences, this report examines trends and influences to consider for making informed decisions in a rapidly evolving environment.
Building Models Used To Calculate Price Data
Gordian’s data team researches material, labor and equipment prices and quantities in cities across the U.S. and Canada to create a composite cost model, which is weighted to reflect actual usage in the building construction industry. To capture the types of construction activity typically performed across North America, researchers merged nine building types, which represent those most commonly found across America and Canada. They are:
1. FACTORY (one story)
2. OFFICE (two to four stories)
3. STORE (retail)
4. TOWN HALL (two to three stories)
5. HIGH SCHOOL (two to three stories)
6. HOSPITAL (four to eight stories)
7. GARAGE (parking)
8. APARTMENT (one to three stories)
9. HOTEL/MOTEL (two to three stories)
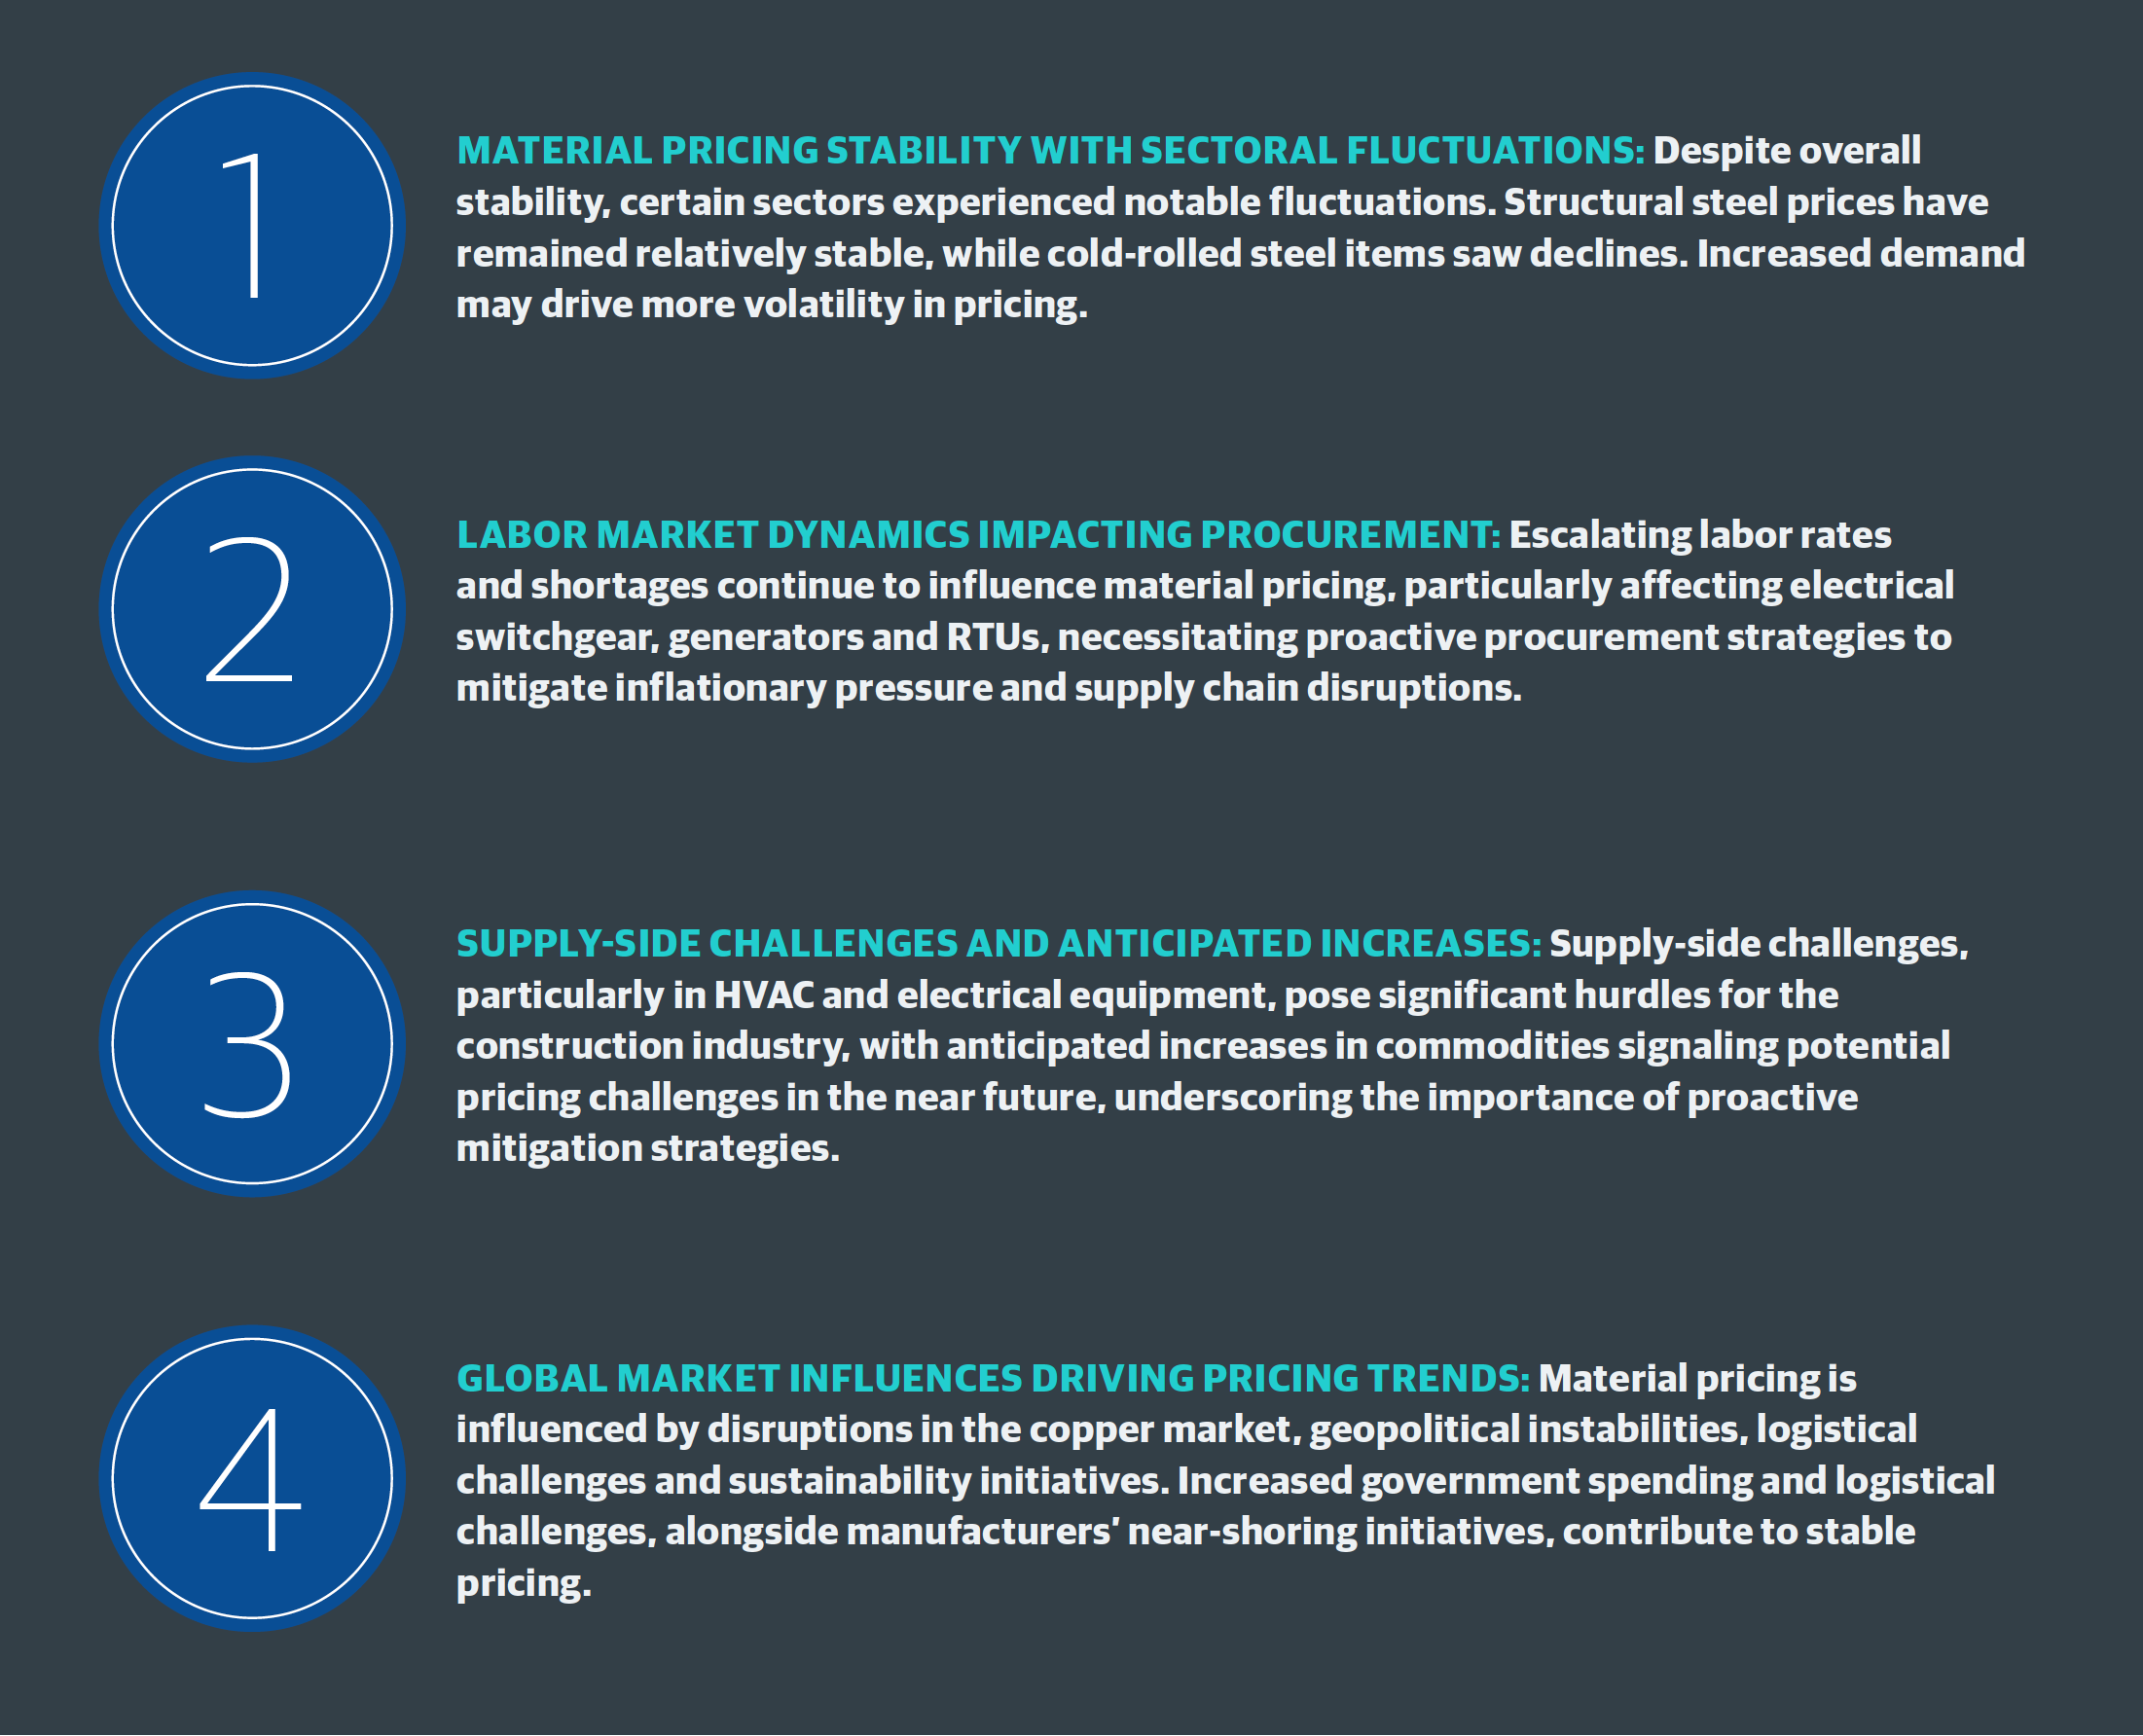
In Q2 2024, the construction material pricing landscape displayed stability overall, with notable fluctuations in specific sectors highlighted by insights from Gordian’s construction cost database, RSMeans™ Data. While certain areas remained relatively stable, others experienced significant shifts. For instance, cold-rolled steel items declined sharply, while clay brick prices surged. Looking ahead, the steel sector is expected to continue to be volatile, shedding light on the need for adaptive strategies to navigate sector-specific challenges.
Additionally, labor market dynamics, as revealed by Gordian’s insights, influenced material pricing, with rising labor rates and shortages impacting procurement strategies. Manufacturing limitations and high demand contributed to prolonged lead times and price hikes in sectors like switchgear. Furthermore, supply-side challenges, particularly in HVAC and electrical equipment, were highlighted by Gordian, driven by growth in AI and data center projects. Ryan Companies anticipates a slowdown in inflation, while STO Building Group projects a steady upward trend in material pricing, highlighting the complex interplay of global events and industry dynamics shaping material pricing trends. [See “The New Prevailing Wage Calculation and Construction Labor Costs” section for further information.]
The construction industry’s pricing trends are intricately linked to global market dynamics, where a confluence of factors shapes material costs and availability. Adam Raimond, Construction Index Manager from Gordian, notes the significance of these global dynamics, particularly in the copper market, where disruptions in the global supply chain and copper’s critical role in green energy initiatives are expected to drive shifts in price dynamics.
Ryan Companies’ Vice President of Procurement, Jeff Halper, highlights several current events and market influences that impact material costs and supply chains. Increased construction spending by the Federal Government drives demand across the industry, contributing to steady pricing. However, geopolitical instabilities in regions like Ukraine and the Middle East may disrupt supply chains and influence material pricing. Furthermore, logistical challenges, such as smaller cargo ships passing through the Panama Canal due to drought conditions, lead to longer lead times. Volatility in the oil market and the recent Port of Baltimore shutdown also add complexities to the supply chain. Additionally, the rise of EV charger mandates and growing emphasis on sustainability, influenced by recent SEC guidance, shape market demand and product preferences.
How National Average Material Costs Are Determined
Gordian’s team contacts manufacturers, dealers, distributors and contractors all across the U.S. and Canada to determine national average material costs. Included within material costs are fasteners for a normal installation. Gordian’s engineers use manufacturers’ recommendations, written specifications and/or standard construction practice for size and spacing of fasteners. The manufacturer’s warranty is assumed. Extended warranties and sales tax are not included in the material costs.
Note: Adjustments to material costs may be required for your specific application or location. If you have access to current material costs for your specific location, you may wish to make adjustments to reflect differences from the national average.
Jeff Hamilton, Director of Strategic Sourcing at STO Building Group, notes the fluidity of the market, highlighting manufacturers’ near-shoring and reshoring initiatives, which have contributed to steadier pricing and better control over supply chains. The construction industry’s adoption of digitization is also noteworthy, promising further transformations in material procurement and pricing dynamics.
These insights underscore the evolving landscape of the construction industry, driven by global trends and technological advancements, necessitating proactive strategies to navigate market uncertainties effectively.
Firms like Ryan Companies and STO Building Group are at the forefront of pioneering approaches aimed at enhancing efficiency and resilience in the building product supply chain and materials cost estimation.
Ryan Companies, as articulated by Jeff Halper, has strategically fostered robust relationships throughout the supply chain, mitigating the impact of price increases and supply delays by forging partnerships with distributors and manufacturers. This proactive approach ensures a competitive edge during material shortages. Additionally, advancements in estimating technology provide deeper insights into project costs and budgets, enhancing overall cost management effectiveness.
Meanwhile, STO Building Group, as noted by David Hamilton, is spearheading the development of a digital platform to aggregate material data, providing manufacturers with enhanced visibility into demand pipelines.
This initiative streamlines material procurement processes and leverages STO’s market position to negotiate favorable costs for clients. Anticipated to launch in late Q3 or Q4, this initiative underscores STO’s commitment to leveraging technology for optimizing supply chain operations and delivering value to clients.
In This Quarterly Construction Insights Report:
In this Quarterly Construction Cost Insights Report, we will be examining key data points surrounding construction material pricing. We will look at the Historical Cost Index, offering a retrospective lens on pricing trends, and the City Cost Index, providing a granular view of localized market variations. In addition, we will thoroughly explore the pricing trends of six key building materials:
- STRUCTURAL STEEL
- FRAMING LUMBER
- CONCRETE BLOCK
- CONDUIT
- COPPER ELECTRIC WIRE
- FIBERGLASS INSULATION
The New Prevailing Wage Calculation and Construction Labor Costs
The construction labor market has tightened to unprecedented levels. Demand for skilled workers outpaces supply, creating a hyper-competitive environment where wages have soared to attract the necessary workforce. This dynamic has been exacerbated by the highest sustained inflation in the U.S. economy since 1981. The Infrastructure Investment and Jobs Act (IIJA) amplified labor demand with its significant financial injection into public works and infrastructure projects.
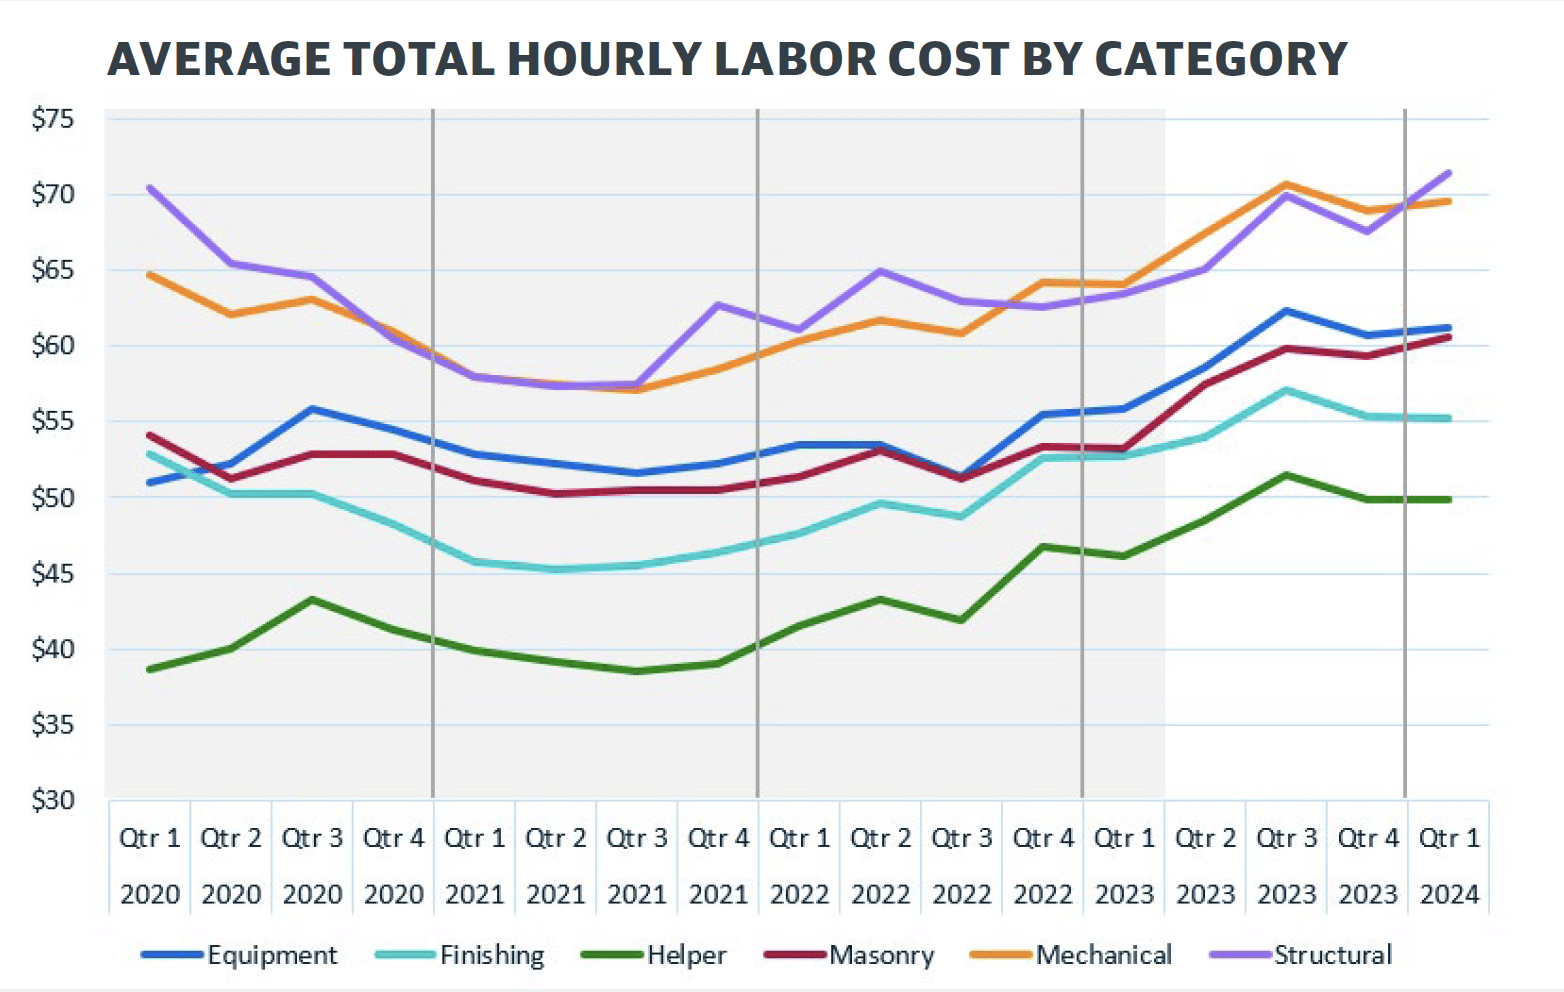
Construction wages increased to match market forces, rising an average of 20% from 2021 to 2023, per a comprehensive January 2024 report by Gordian and ConstructConnect. See Chart 1 for a categoric breakdown.
Federal Mandates Include New Prevailing Wage Calculation
Looking beyond 2024, two changes in federal construction labor dynamics are likely to exacerbate increasing costs. The first is the mandate of Project Labor Agreements (PLAs) for all federally funded projects exceeding $35 million in contract value, per an Executive Order issued in February 2022. PLAs potentially inflate project labor costs by 12%-20%. Considering that approximately 40% of the $34 billion federal construction budget may be affected, contractors are bracing for a widespread impact on labor costs.
CHART 1: AVERAGE WAGE GROWTH BY TRADE, 2021 TO 2023
The second change involves the Department of Labor’s overhaul of the Davis-Bacon Act. This revision reinstated the “3-step” calculation for prevailing wages, which had been a “2-step” calculation since 1983:
- The wage rate paid to a majority of workers in the classification, or
- If no rate is paid to at least 50% of workers, then the weighted average rate in the classification.
The prevailing wage will now be calculated thusly:
- The wage rate paid to a majority of workers in the classification, or
- If no majority exists, the rate paid to 30% of workers, or
- If no rate paid to at least 30% of that classification’s workers, then the weighted average in the classification.
The overhaul changed the mechanisms by which urban and rural wages are differentiated and updated between survey releases. With an estimated 1.2 million workers affected, the new calculation method is expected to elevate wages, particularly in regions with moderate-to-weak union presence, where collective bargaining agreements will exert greater influence in establishing prevailing wages.
Bonus content: How the new prevailing wage calculation will impact construction labor costs.
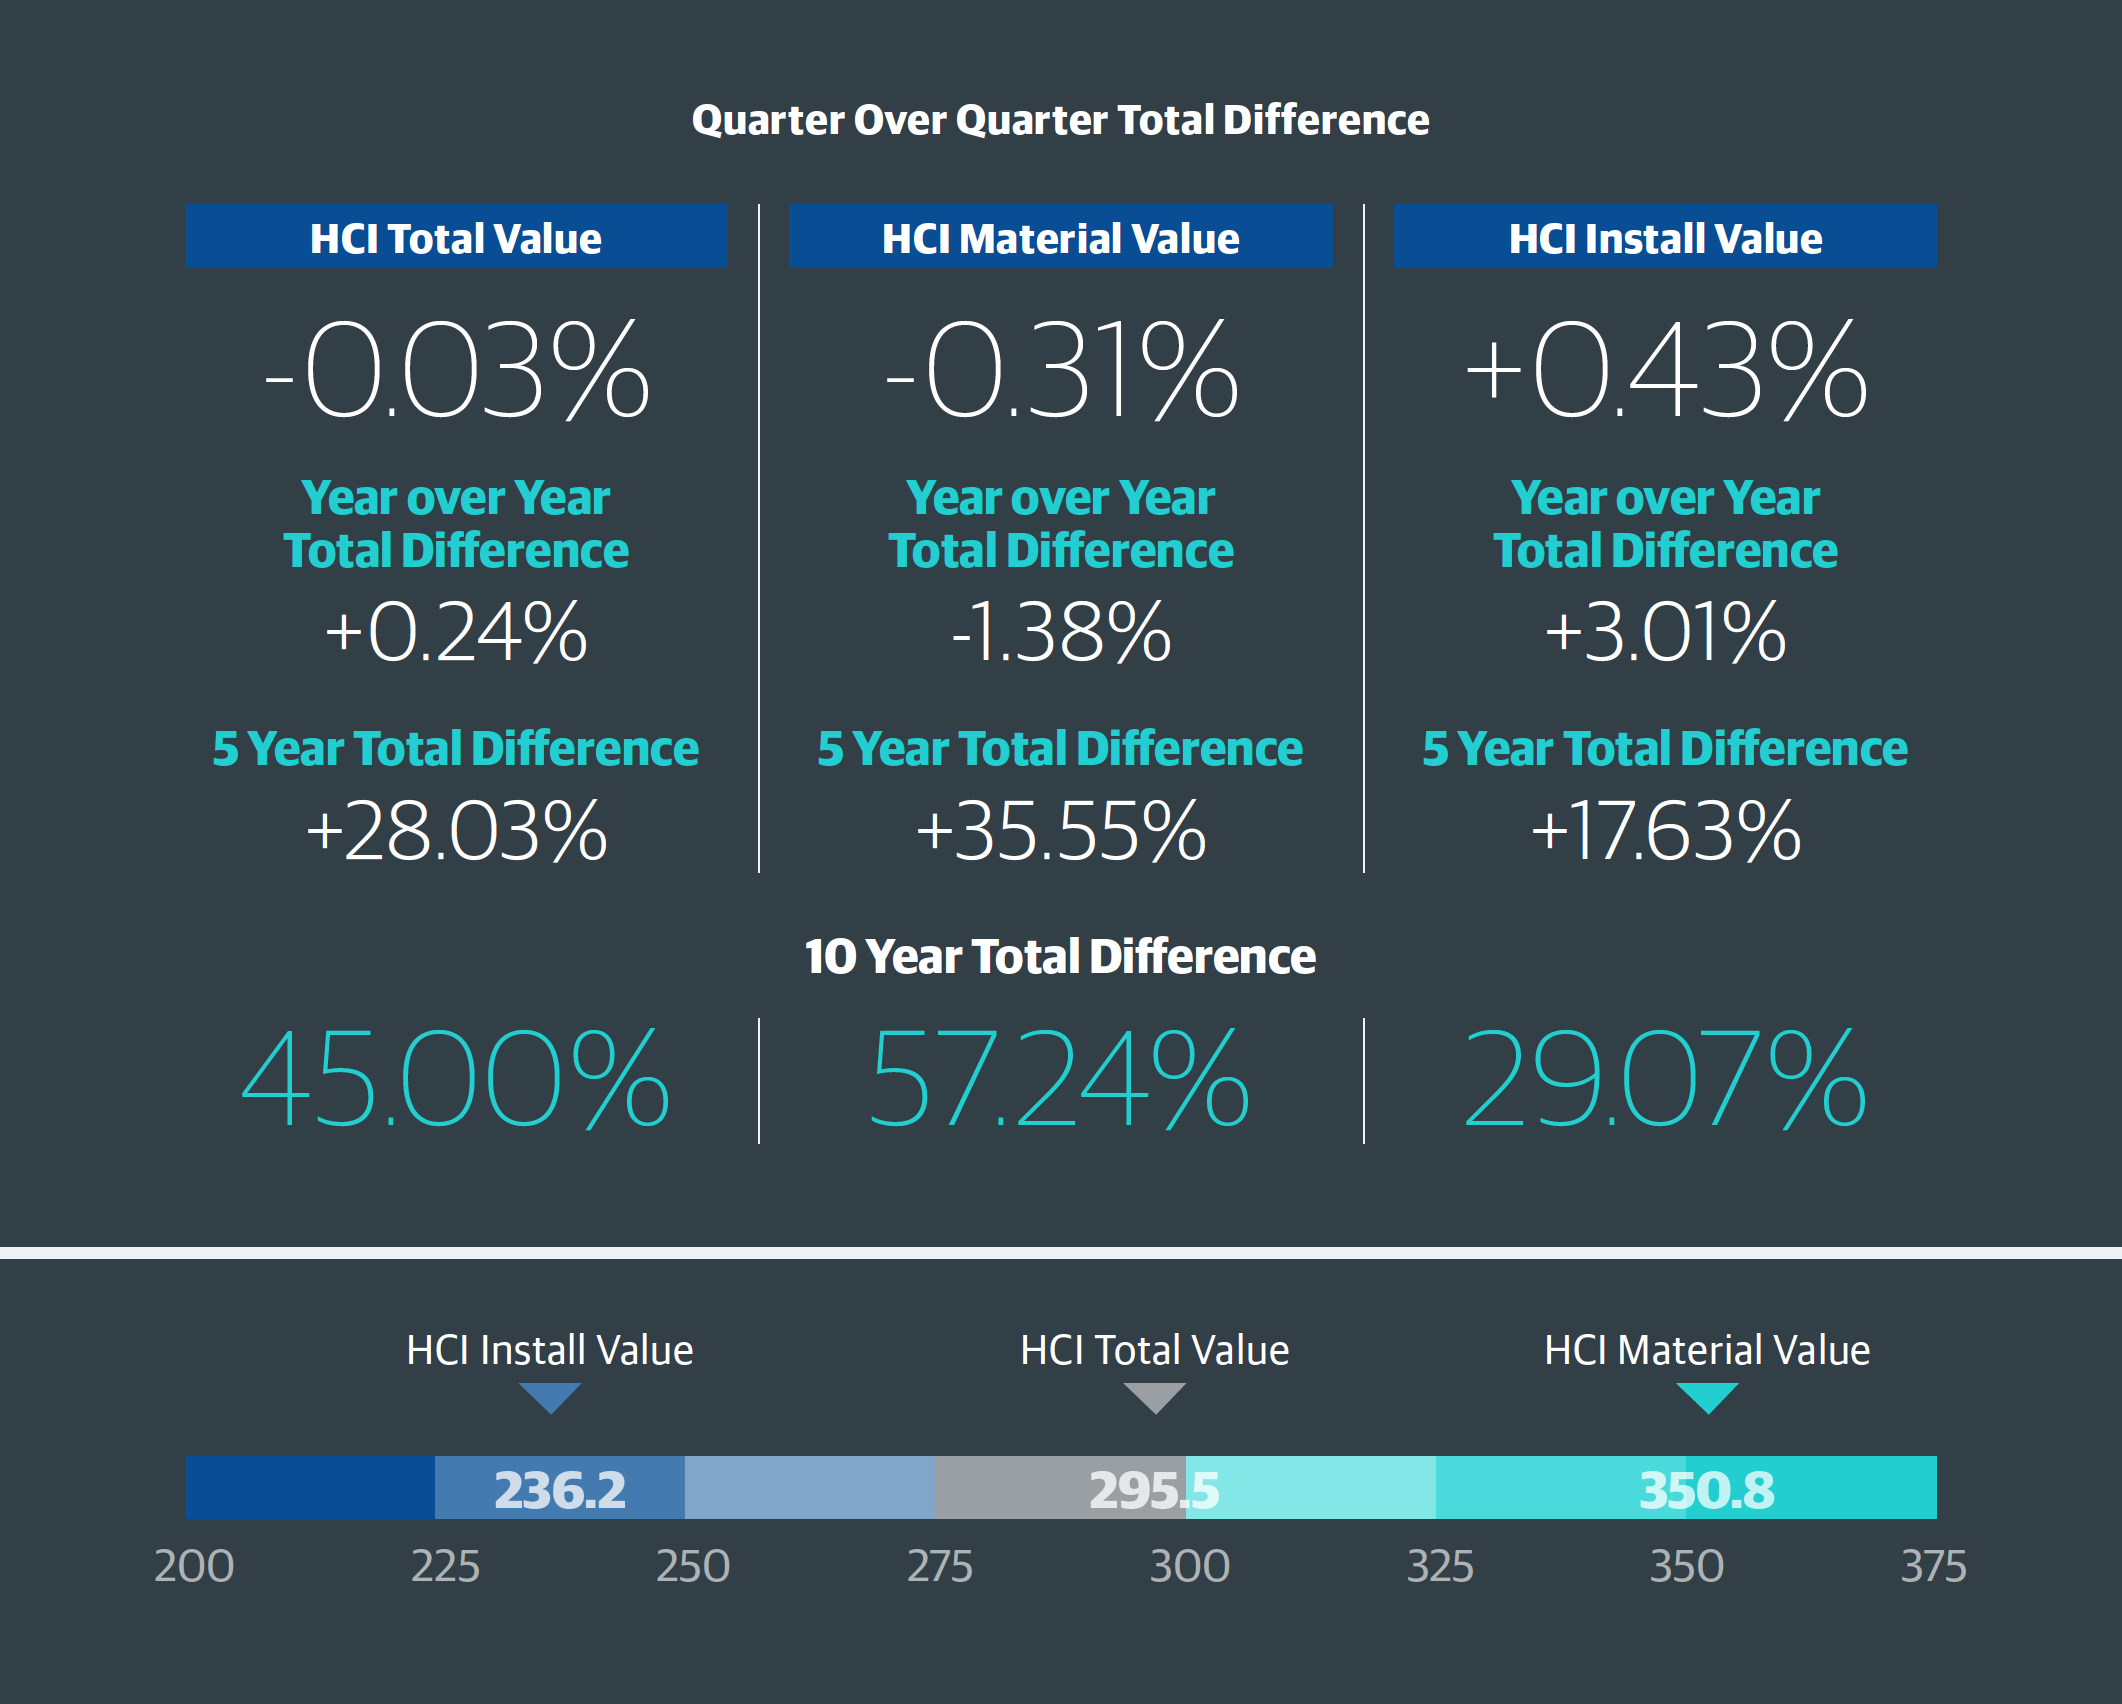
The HCI (Historical Cost Index) is an invaluable tool to track changes in the cost of construction materials and labor over time. The HCI Total Index Value represents the overall change in construction costs, including materials, labor and installation expenses. The HCI Material Value tracks the change in the cost of raw materials, such as lumber and steel. The HCI Install Value measures the change in the cost of installation labor, including plumbing, electrical and HVAC. These indices provide valuable insights, helping building industry professionals to anticipate and plan for changes in construction costs and make informed decisions about project budgets and timelines.
NOTES
- The index values are based on a 30-city national average with a base of 100 on January 1, 1993. The three numbers are the total, material, and install index numbers, respectively, for the 30-city national average in 2024.
- The Historical Cost Index (HCI) applies the quarterly City Cost Index (CCI) updates to a historical benchmark and allows specific locations to be indexed over time. These indexes with RSMeans Data are a vital tool for forecasting construction costs and can be a valuable source of information for comparing, updating and forecasting construction costs throughout the United States.
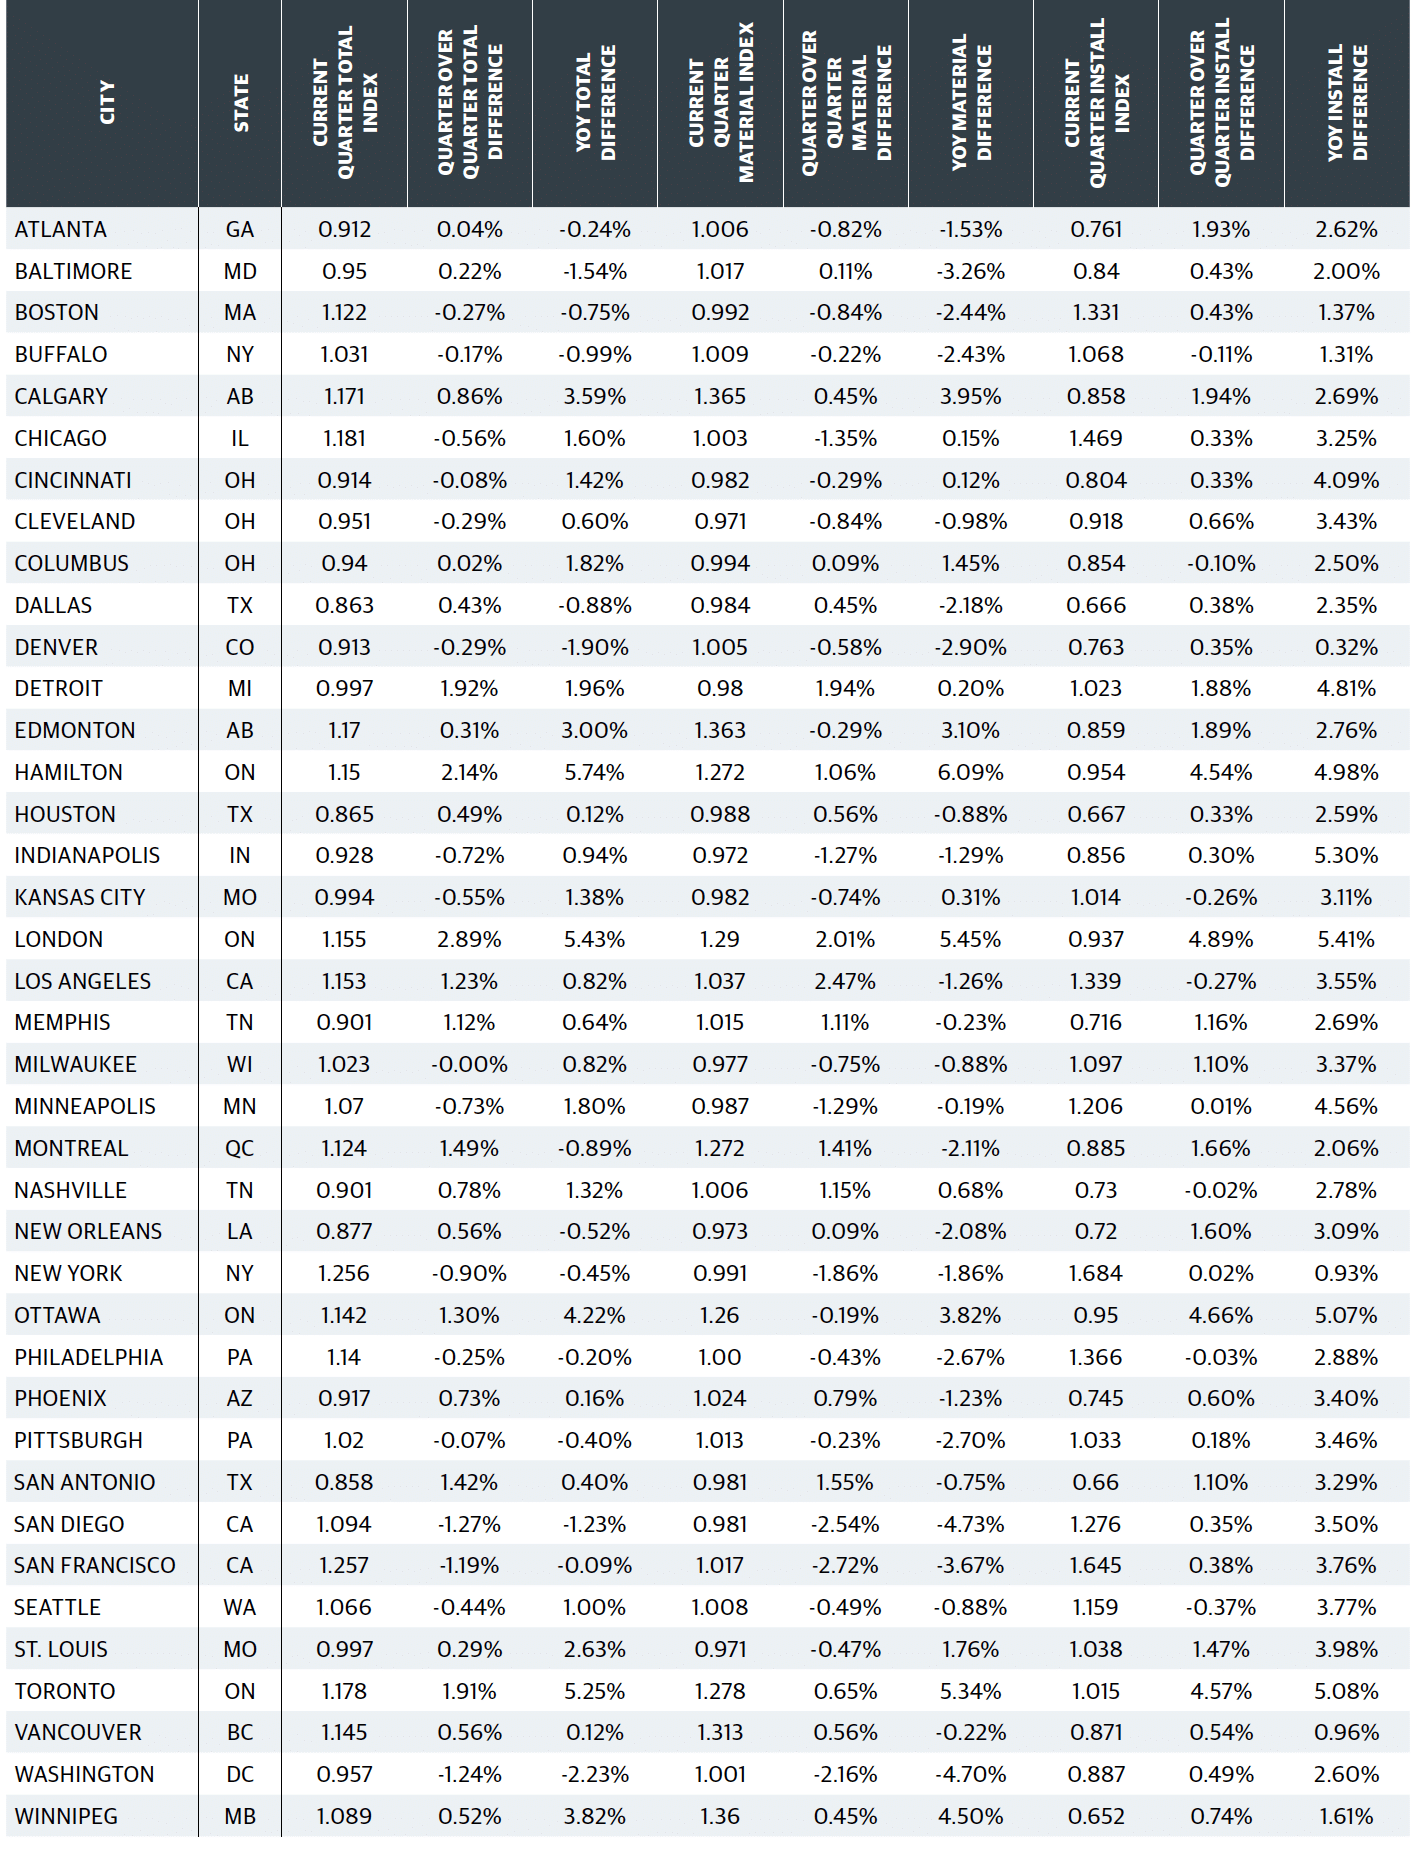
The City Cost Index is a quarterly data product designed to answer the question, “How much higher/lower are costs in my city relative to the national average?” The CCI can be used to better reflect localized pricing in construction estimates. Each quarter, Gordian’s RSMeans Data research team collects prices from cities across the United States and Canada, which are then compared to the national average and the current year’s annual release data to create the CCI. The City Cost Index shows a factor for Material, Installation and Total with rows representing multiple CCI divisions. Additionally, the CCI shows a Material Total, Installation Total and a Total Weighted Average.
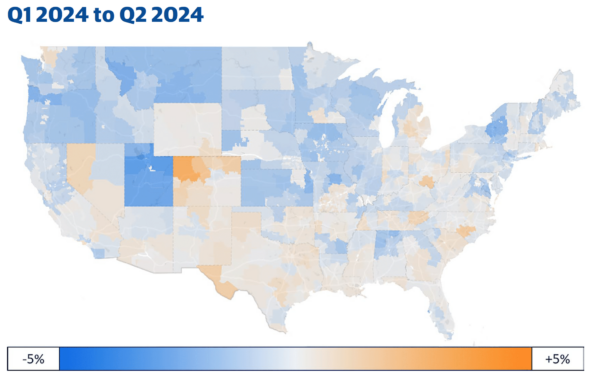
In the big picture, material prices for the overall building model did not see large changes from Q1. However, a couple of sectors did see notable price movements. The two most noteworthy areas were cold rolled steel items like metal decking and galvanized steel sheets, which saw double digit percentage declines in the last three months, along with prices of clay brick seeing increases for the first time since early 2023. High brick prices will likely sustain throughout 2024, or even increase further. Steel, on the other hand, will likely continue the volatility of the past three years. On a regional level, the impact of metal price decreases and slowly accelerating labor rates was felt more in a swath of Midwest states than the rest of the nation.
Want to see how your projects are impacted by localized costs? Sign up for a free trial of RSMeans Data Online to see our data in action.
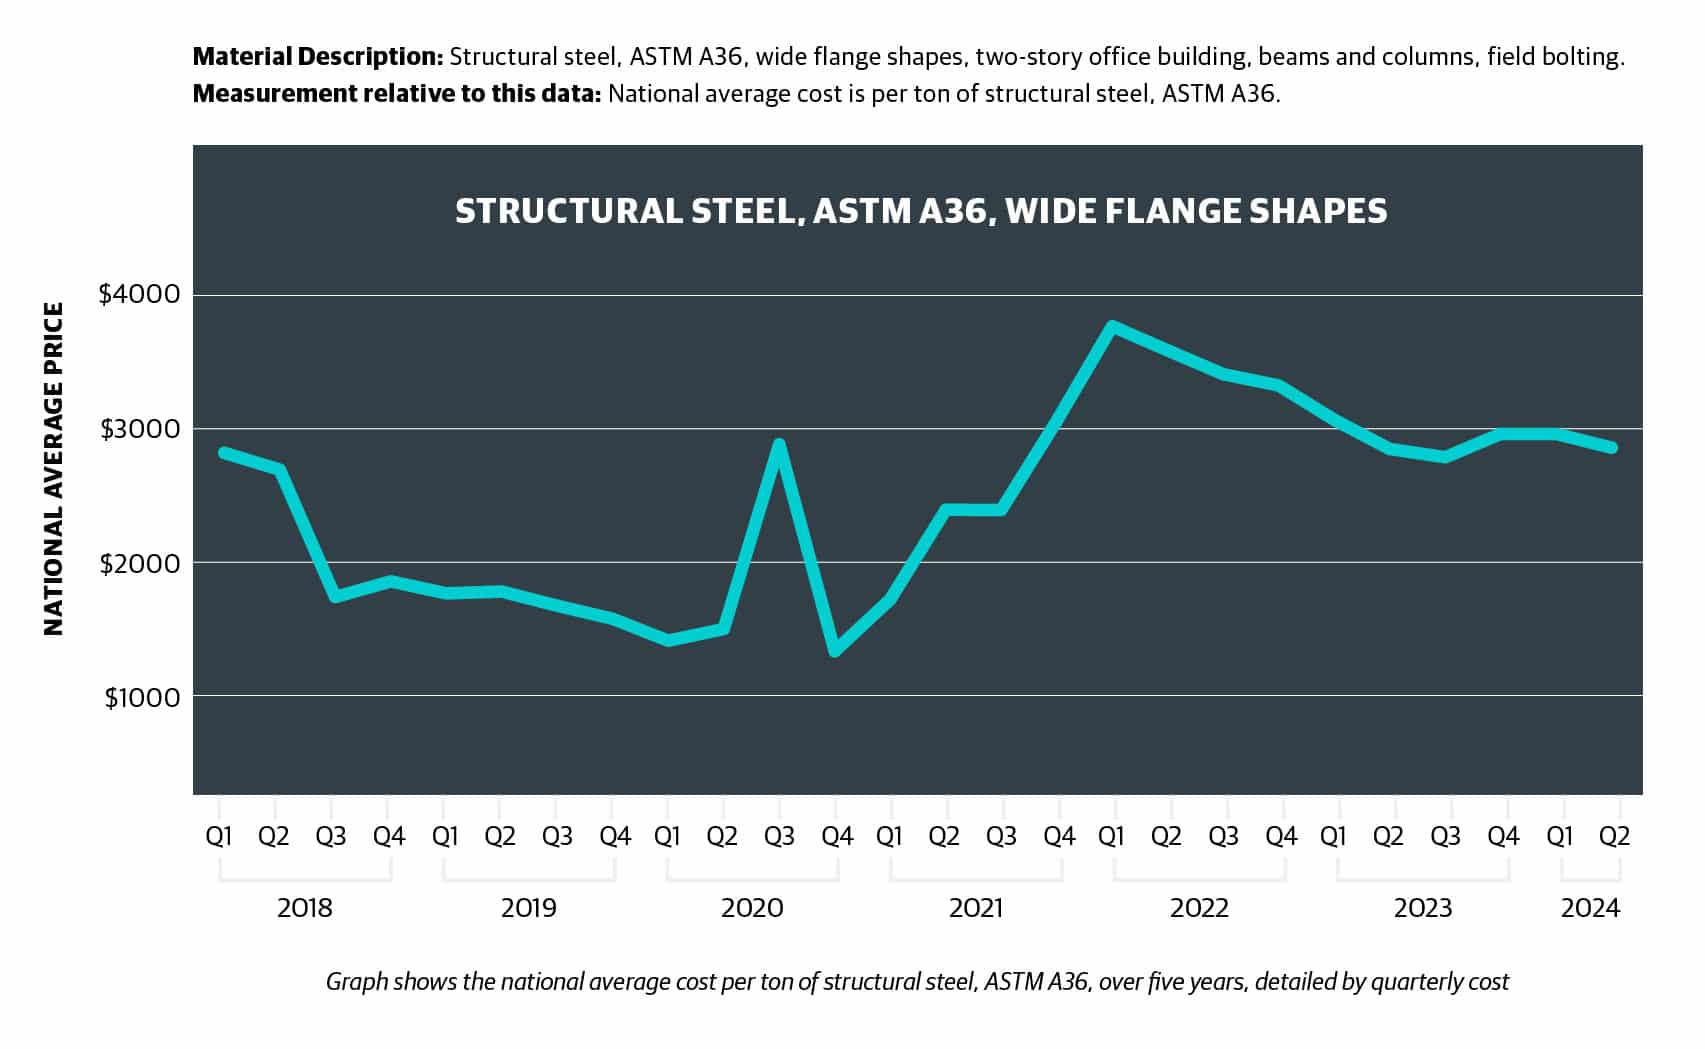
What the data says:
- Late 2022 witnessed cost acceleration due to supply chain constraints.
- Cost stabilizations/decreases persisted through Q1/Q2/Q3 2023.
- Q4 2023 experienced a 6.85% quarter-over-quarter increase, yet remained below the highs of 2022.
- Q1 2024 showed no significant change from Q4 2023, with a year-over-year decrease of 3.75%, while Q2 sees a 3.80% decrease since Q1.
View from the field:
GORDIAN: “Unlike cold-rolled steel, there has been more pricing stability with structural steel. However, there was a price increase of about 2-3% to start off 2024.”
RYAN COMPANIES: “Prices are well below those in 2021-2022. However, we anticipate more volatility with bigger peaks and valleys. Lead times should remain stable.”
Read more on what the data says about steel.
What the data says:
- 2023 lumber prices declined after climbs since 2020.
- Pricing stabilization/decrease seen in Q2/Q3 2023, with slight increase in Q4 2023.
- Q1 2024 saw a 6.24% decrease since Q4 2023, and a large year-over-year decrease of 18.78%.
- Q2 is nearly flat with Q4 2023.
View from the field:
GORDIAN: “Pricing entering 2024 is about the same as it was in Fall 2023. That likely won’t persist, however, with activity starting to increase in the spring and summer.”
RYAN COMPANIES: “This is trending similarly to structural steel pricing. Framing lumber looks to stay well below peak pricing, but not as low as it was pre-pandemic.”

Read more on what the data says about lumber.
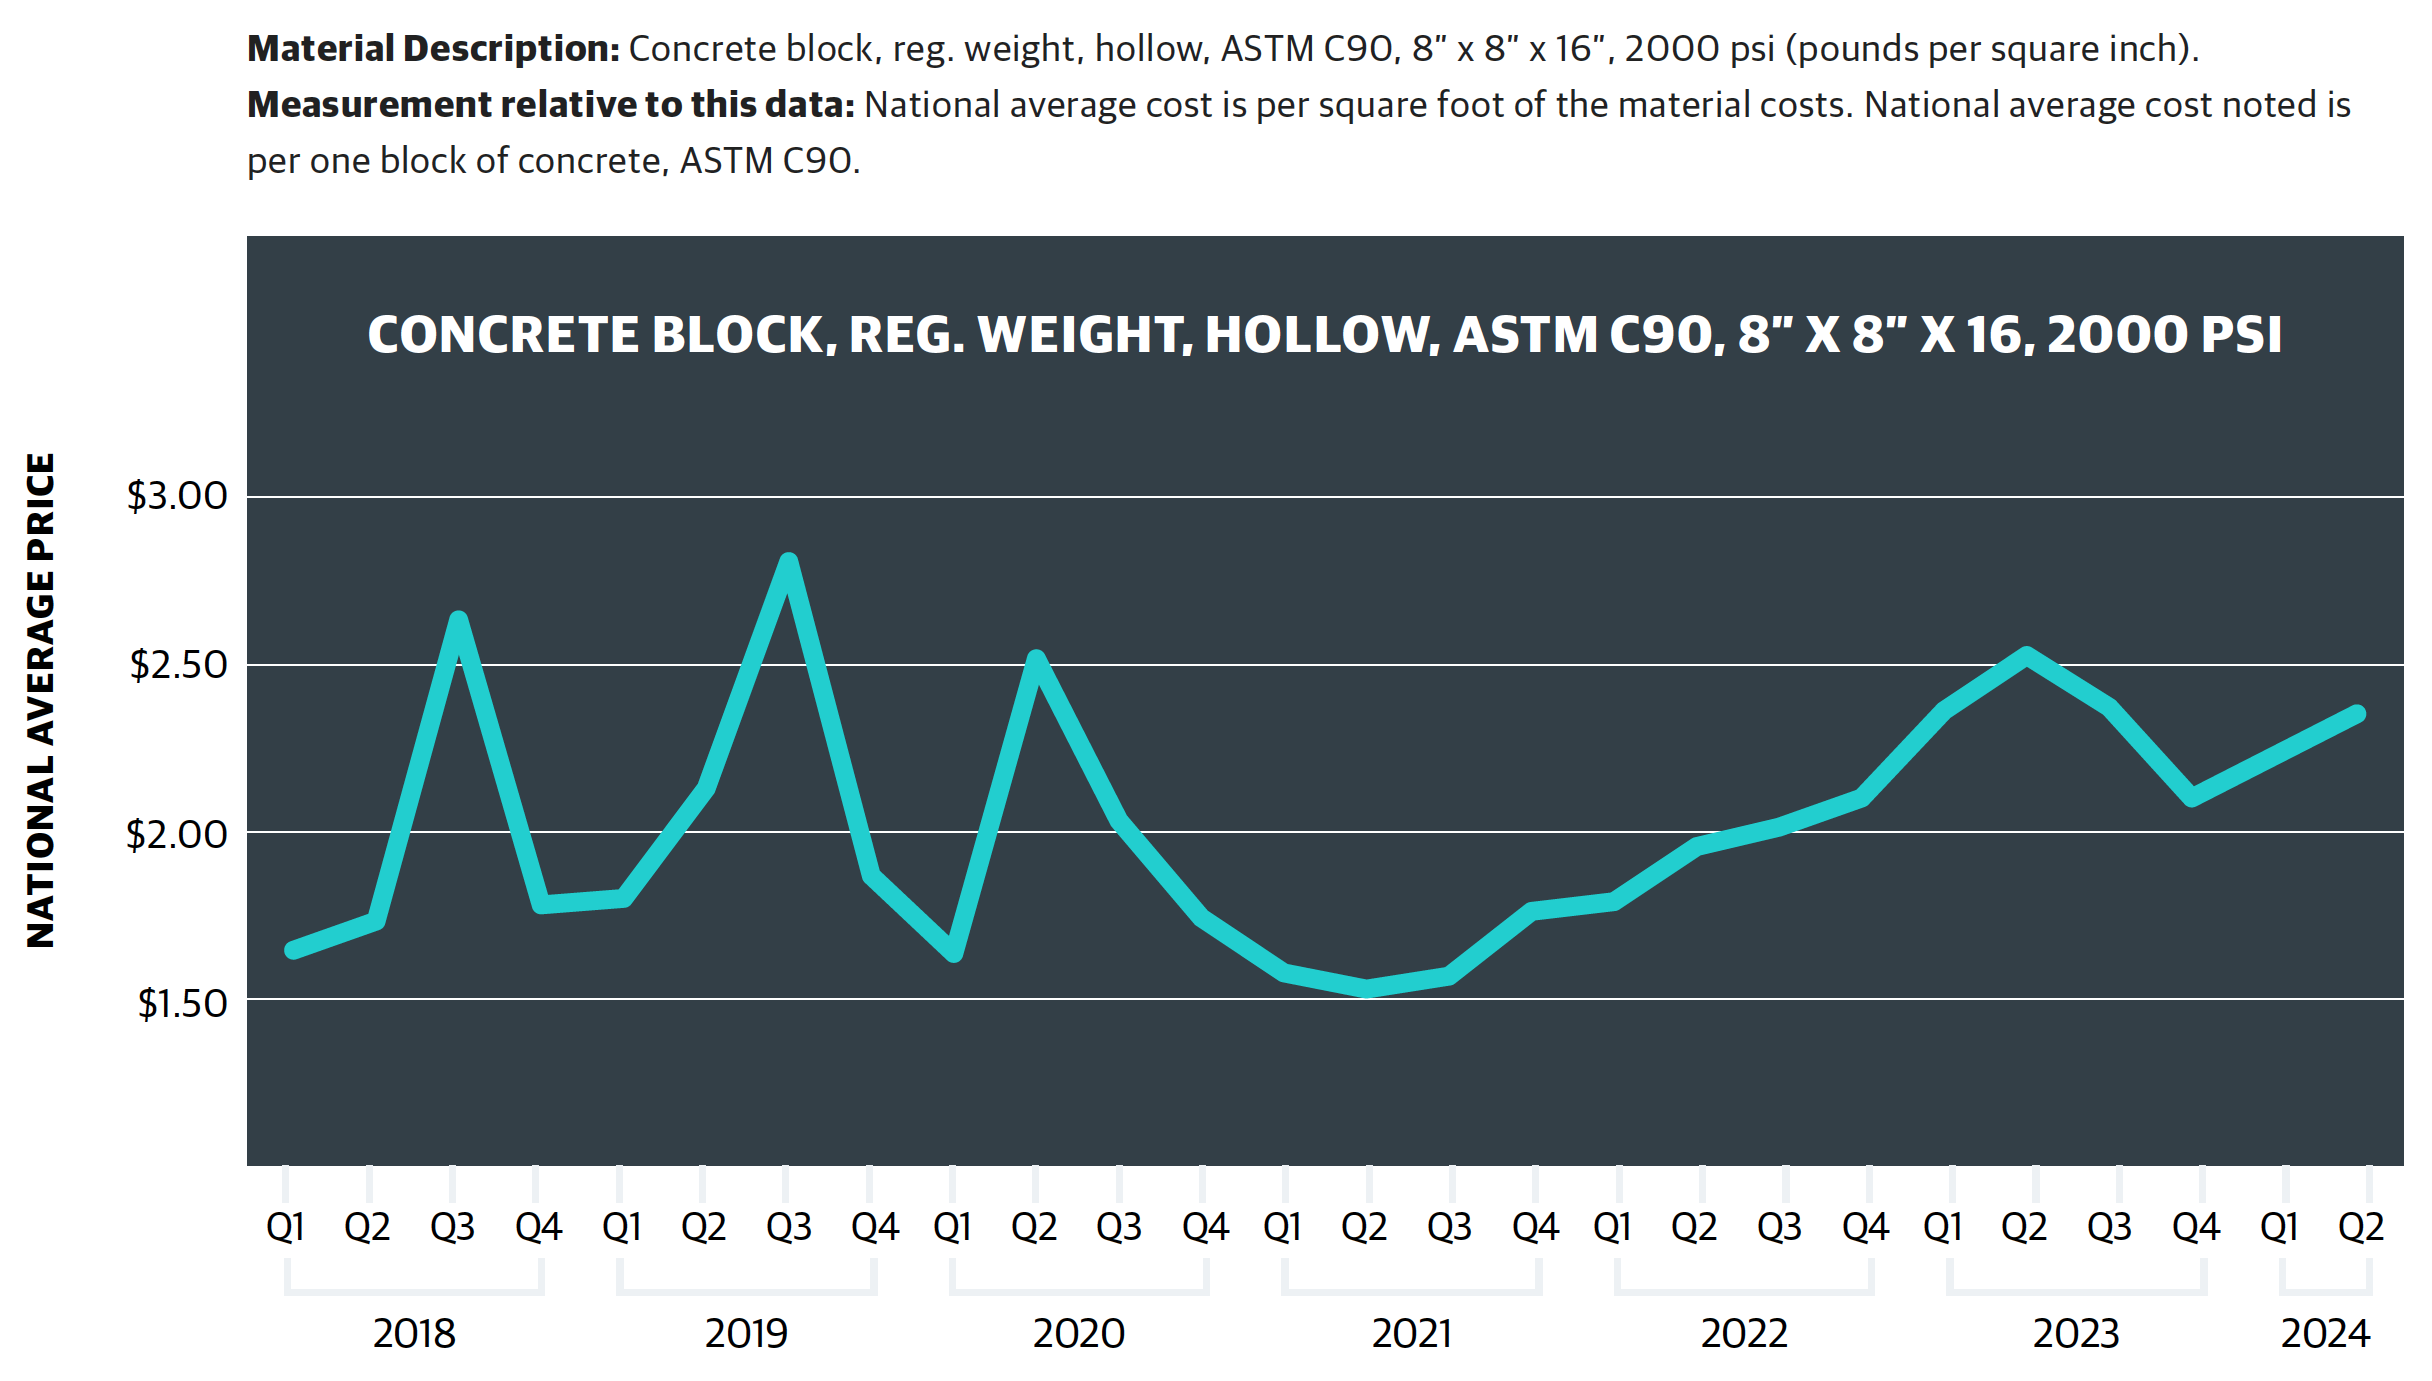
What the data says:
- High price increases through most of 2022, driven by supply constraints.
- Q2 2023 rose but at a lower rate than Q1; Q3 and Q4 each saw a slight decline.
- Q1 2024 saw a 6.16% increase from Q4 2023.
- Q2 2024 data for concrete block pricing reveal a 5.80% increase since last quarter but still a 7.14% reduction year over year, continuing the trend.
View from the field:
GORDIAN: “Prices for concrete blocks increased heading into 2024-Q2, after a few months of notable price drops at suppliers across the country. A combination of a long-running fear of cement shortages and inconsistency of
supply of blocks are likely contributors to the erratic prices as of late.”
Read more on what the data says about concrete block.
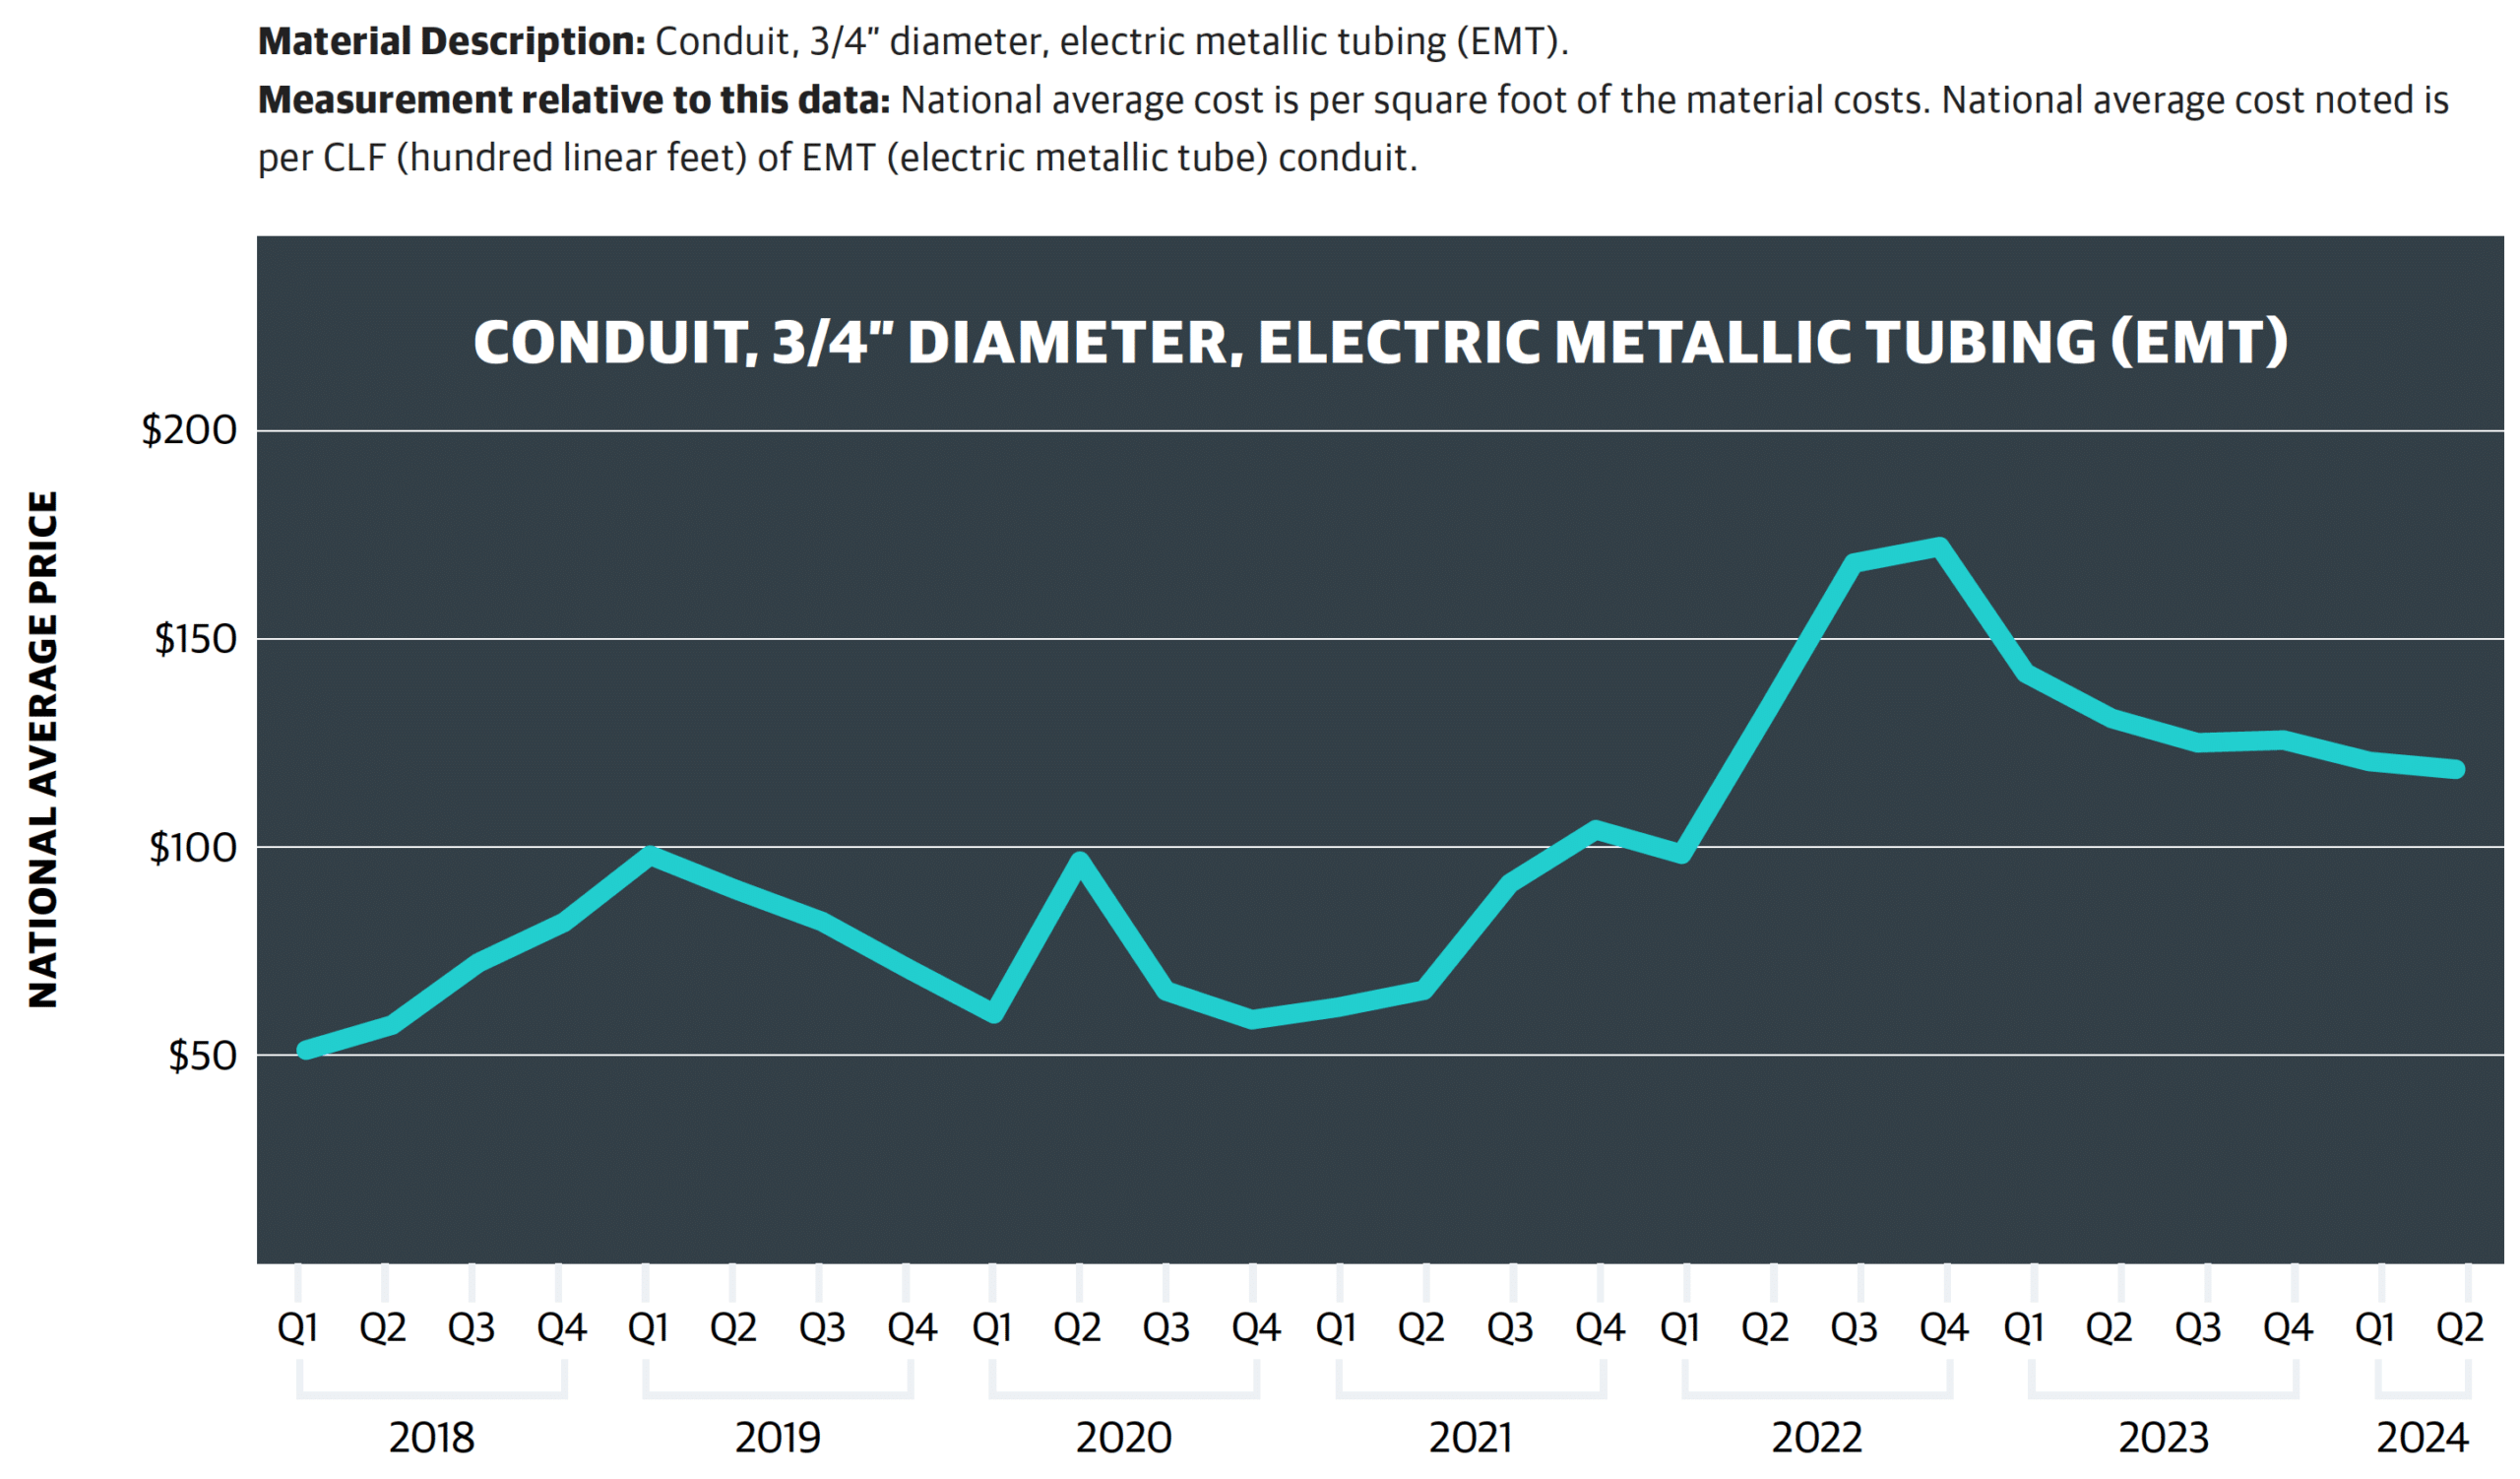
What the data says:
- Significant escalations in Q2 – Q4 2022 driven by international supply chain.
- 2023 prices slowly fell from 2022 highs, although Q4 did experience a very slight increase.
- Conduit pricing in Q1 2024 was down just over 4% since Q4, but had decreased almost 15% from the same time last year; it continues to fall slightly heading into Q2.
View from the field:
GORDIAN: “There’s currently an unexpected surplus supply of aluminum (what conduit is made of), and as a result that has kept conduit prices consistent for the last year. This trend should continue.”
Read more on what the data says about conduit.
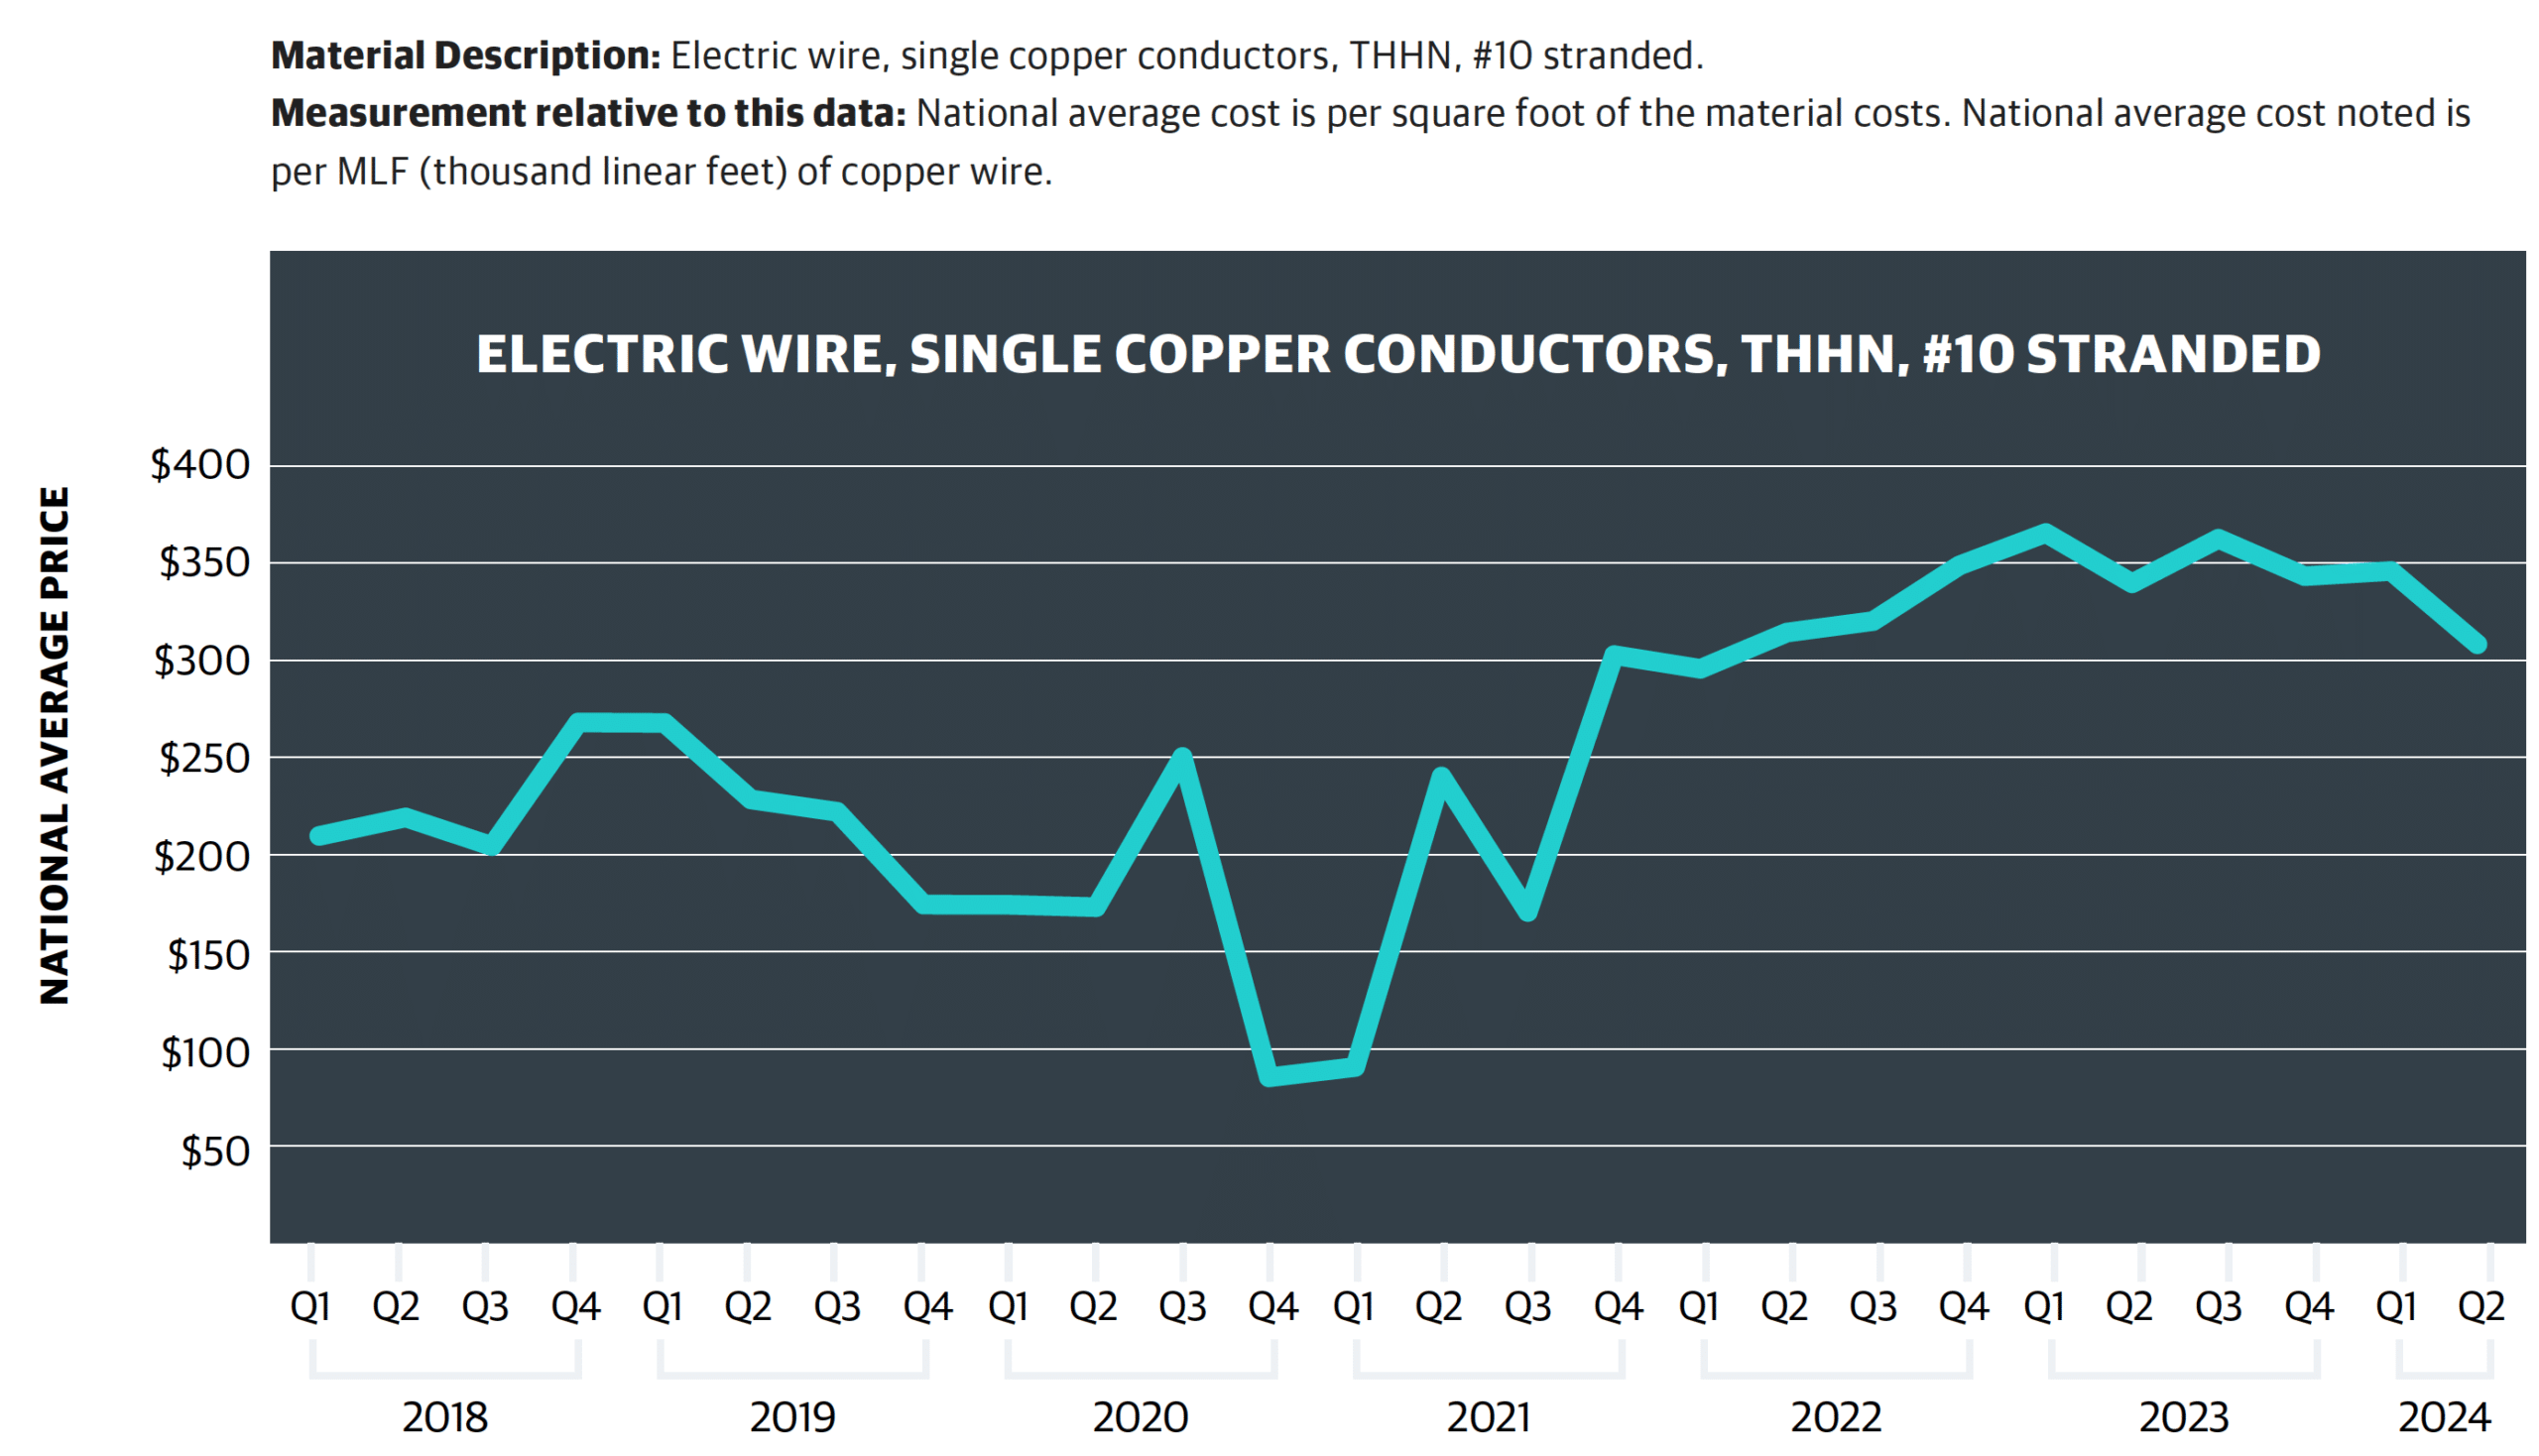
What the data says:
- Significant escalations in Q2 – Q4 2022 were driven by the international supply chain.
- Copper prices increased into 2023, although closed out Q4 with a minor decrease from Q3.
- Q2 2024 data shows a significant 10.83% price drop since Q1, and just over a 9% decrease year-over-year.
View from the field:
GORDIAN: “Copper has been expected to dramatically increase in price for a while, but instead prices at suppliers decreased in the first three months of 2024. It would be shocking if that trend continued, however. Demand is
expected to increase. Additionally, some supply disruptions are ongoing due to copper mining pauses.”
RYAN COMPANIES: “After prices dropped in mid-2022, copper has been gradually trending upward. We don’t anticipate this to change anytime soon.”
STO BUILDING GROUP: “We believe [copper] will continue to reflect its high demand.”
Read more on what the data says about copper electric wire.
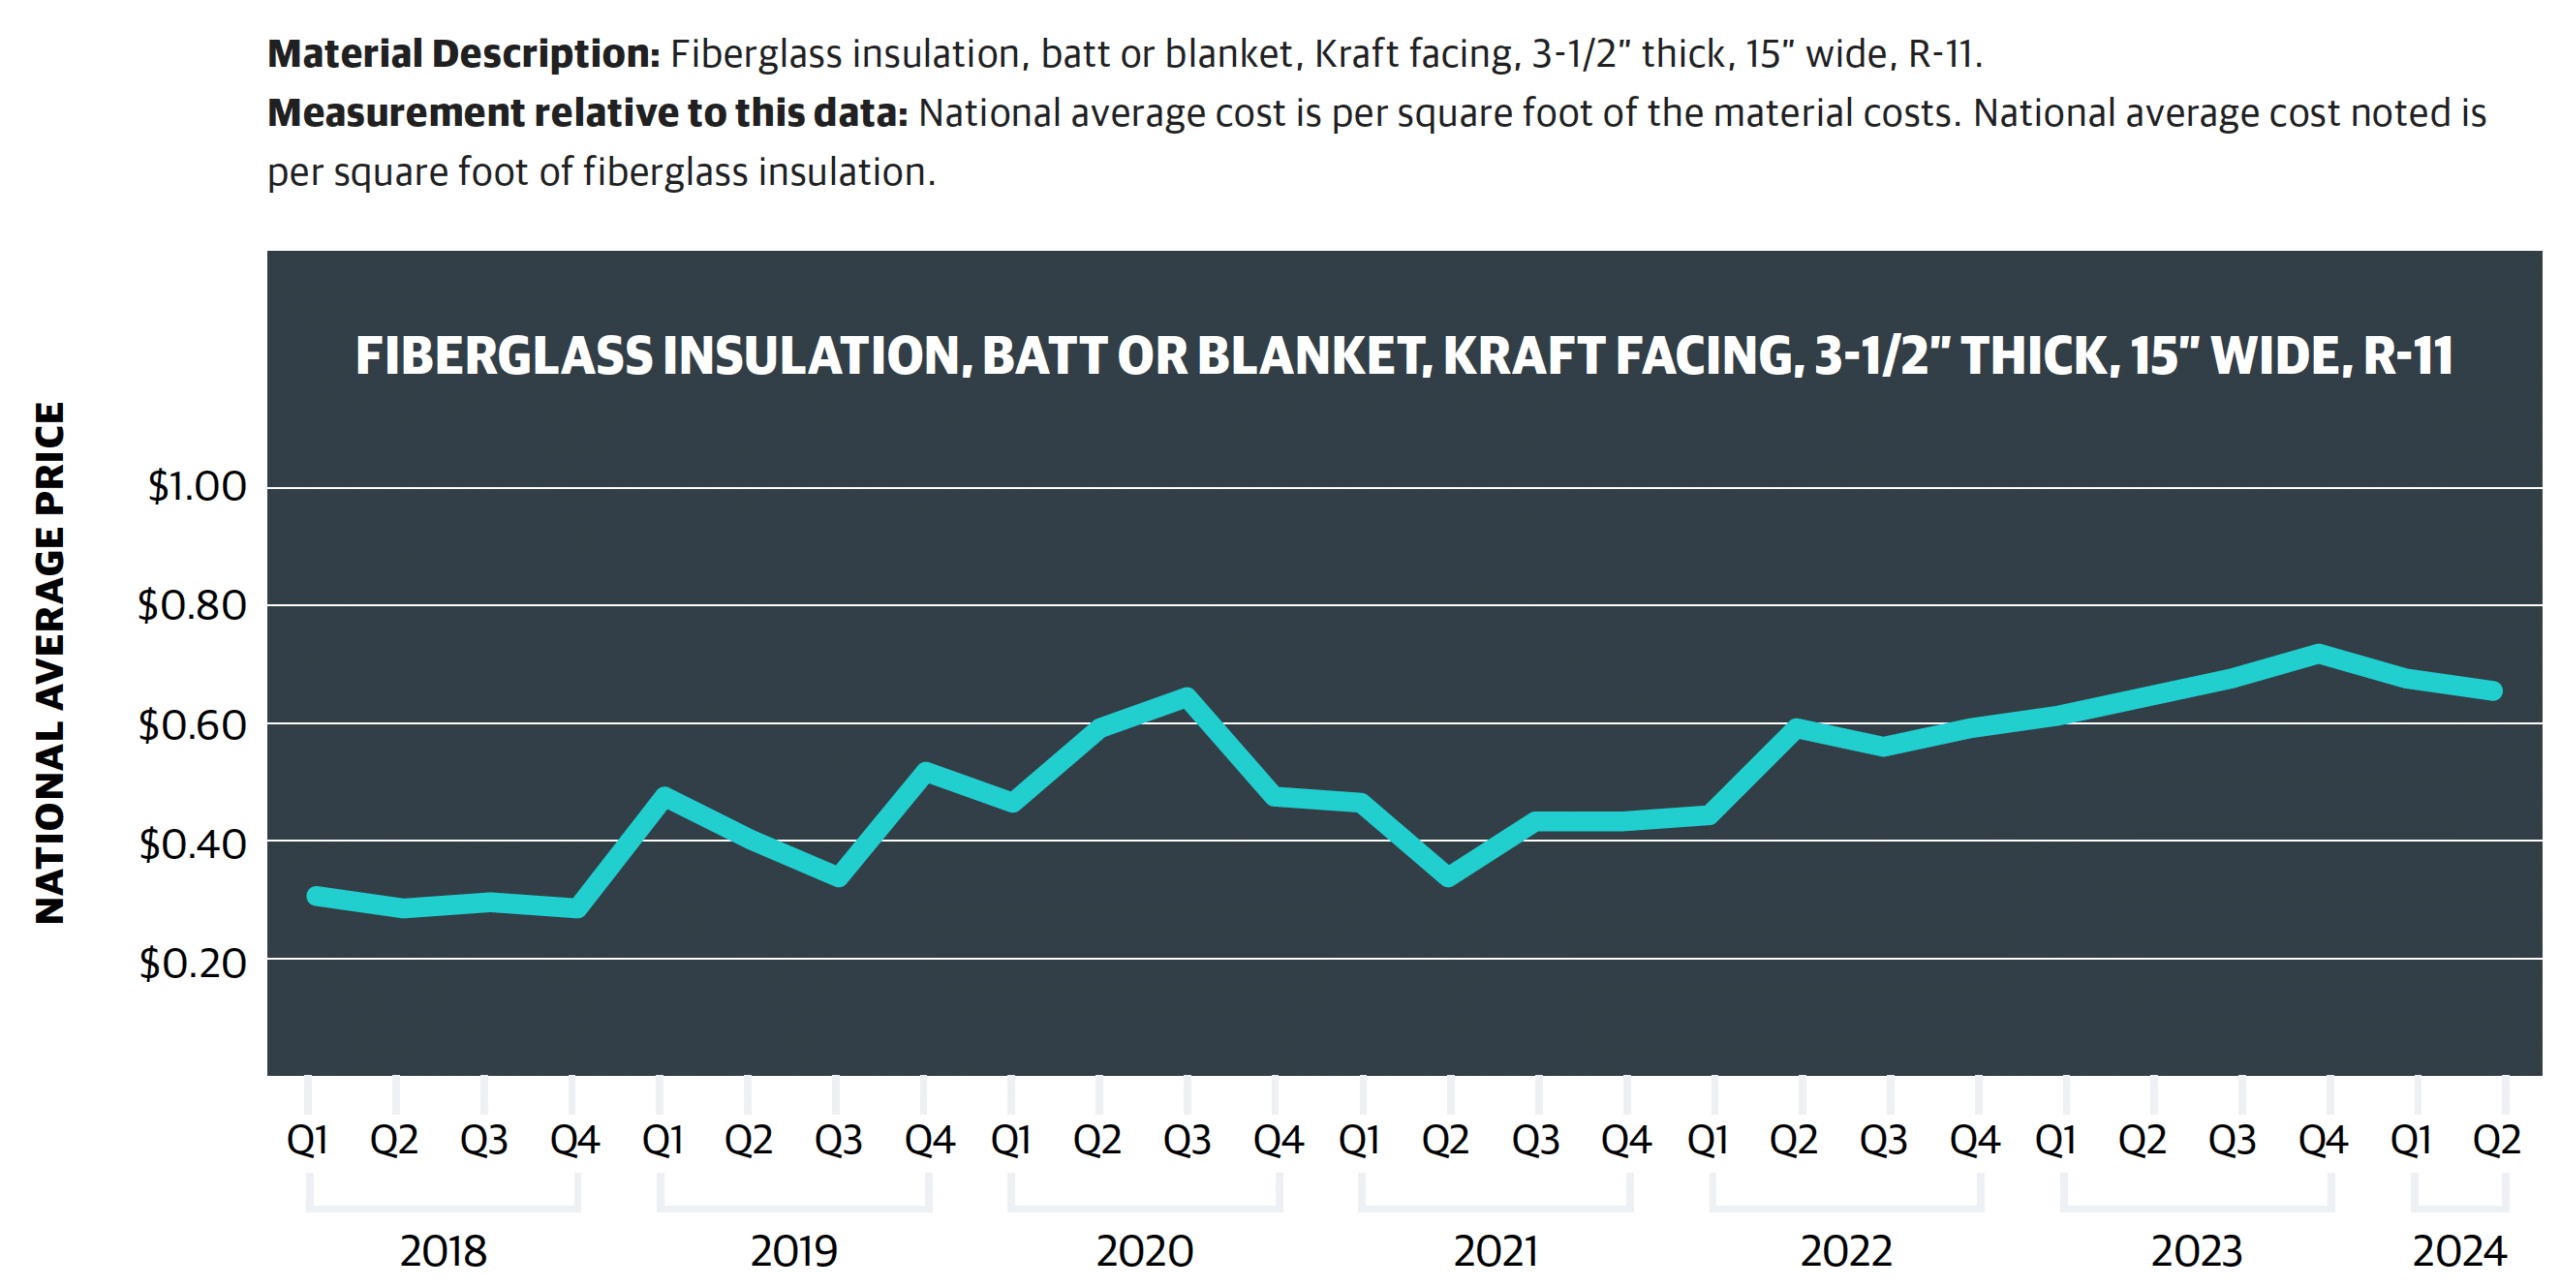
What the data says:
- Supply shortages drove up prices in Q1 2022 after two years of decline.
- Prices held at these higher levels in 2023, creeping up each quarter.
- While Q1 2024 fiberglass insulation pricing saw a decrease (under 6%) from Q4, the year-over-year increase is more than 9%.
- Q2 2024 pricing is relatively unchanged since Q1, with a minor downward trend of under 3%.
View from the field:
STO BUILDING GROUPS: “ … [Fiberglass is] fairly flat and following normal trends of pricing.”
Read more on what the data says about fiberglass insulation.
As construction professionals navigate evolving market conditions, leveraging expert forecasts becomes increasingly crucial in anticipating and adapting to shifting material price trends. By staying informed and proactive, stakeholders can
mitigate risks and optimize procurement strategies to maintain cost-effective project execution.
Gordian’s data team forecasts an upward trajectory in building product costs for the upcoming period, primarily driven by price hikes in specific sectors. Notably, copper prices are expected to increase, alongside anticipated upticks in prices of cement and concrete products. Furthermore, recent decreases witnessed in cold-rolled steel prices are unlikely to persist as the year progresses.
Adam Raimond, Construction Index Manager at Gordian, stresses the importance of monitoring supply chain health, particularly following the Francis Scott Key bridge collapse in Baltimore. This incident could have ramifications across the Mid-Atlantic, East Coast and beyond, highlighting the interconnected nature of supply chain disruptions and their effects on material pricing dynamics.
Halper of Ryan Companies anticipates reduced inflationary pressure for most materials, despite continued challenges and long lead times for electrical switchgear, generators and RTUs. Meanwhile, STO Building Group’s David Hamilton forecasts an overall 4-5% increase in material costs over the next 6-10 months. Factors such as reliance on microprocessors, overseas raw materials and commodity spikes are expected to influence these trends, alongside macrolevel impacts like the November election and escalating tensions in the Middle East. Despite these challenges, investments in market digitization are expected to aid in managing these impacts and optimizing procurement strategies.
In the dynamic landscape of construction material pricing during the second quarter of 2024, Gordian’s comprehensive analysis, supported by insights from industry leaders at Ryan Companies and STO Building Group, uncovers a nuanced panorama. While stability prevails overall, specific sectors experience notable fluctuations. Gordian’s data-driven forecasts, complemented by STO Building Group’s supply-side insights and Ryan Companies’ innovative strategies, offer a holistic understanding. These insights empower leaders to navigate challenges proactively, fostering sustainable growth in the construction industry.

The Following Supply Chain and Preconstruction Subject Matter Experts Contributed Their Views for this Q2 2024 Analysis:
GORDIAN
- Sam Giffin, Director, Data Operations
- Adam Raimond, Construction Index Manager
RYAN COMPANIES
- Jeff Halper, Vice President of Procurement
STO BUILDING GROUP
- David Hamilton, Director of Strategic Sourcing
Additional Resources
- Gordian Construction Data and Insights Hub
- https://www.bloomberg.com/opinion/articles/2023-03-23/cement-shortages-concrete-inflation-threaten-biden-sinfrastructure-boom
- https://about.bnef.com/blog/copper-prices-may-jump-20-by-2027-as-supply-deficit-rises/
- https://www.cnbc.com/2024/01/03/copper-appears-set-torally-more-than-75percent-by-2025-analysts-say.html
- https://think.ing.com/articles/aluminium-surplus-to-persistas-demand-disappoints/
- https://www.freightwaves.com/news/what-can-we-learn-from-the-truckload-spot-to-contract-rate-spread
- https://www.uschamber.com/workforce/understandingamericas-labor-shortage-the-most-impacted-industries
- https://www.eesi.org/papers/view/fact-sheet-buildingsustainably-mass-timber-september-2023
Share this:


