Remember all the talk of relocating the FBI headquarters building? Plans were made, then later scrapped, to move the building outside the Washington D.C. city limits. All politics aside, the potential of moving an important agency headquarters is an interesting situation – one that serves as a solid basis for a thought experiment. city cost index
Let’s say that a large Federal agency is looking to relocate its main campus. Except this time, the agency is looking all across the nation for a potential new home. Upon the announcement that they’re considering a move, the agency head begins receiving calls daily from city officials across the U.S., all declaring that their city would be the perfect home for a new headquarters. After a few weeks of meetings, the list is narrowed down to 12 cities.
Most of these cities are large, with area populations in the millions, like San Diego, Nashville and Austin: The types of cities you’d expect to be interested. But some are unexpectedly small, like Little Rock, Spokane and Kansas City. The agency has made it clear that a key factor for choosing a location is the cost of building their new campus. If they’re going to move, they want to make sure the price of relocating won’t create a public relations problem.
And this is where you come in: In order to get pricing estimates for building in these cities, the agency’s head contacts you. They have a generic campus design, complete with workspace layouts, conference rooms and physical access control systems, but you need to determine what it could cost to build in the each of these 12 cities between one year and two years in the future.
How would you go about building a list of estimates for a large, complex project and be confident that your figures reflect actual market costs for different locales? It’s a difficult task. Luckily, there are tools designed to address this exact problem: The City Cost Index and predictive cost data.
The Reliable Data Source: The City Cost Index
Back in the day, successful intelligence operations hinged on the intel of an agent on the ground or an informant on the inside. But these days, it’s just as important to have a reliable source of electronic data collection, which can do its work from thousands of miles away. When it comes to estimating, the City Cost Index is that source.
The City Cost Index is the tool that enables you to adjust RSMeans Data construction costs to your local market. In its raw form, RSMeans Data is set to a national average price. But here’s the rub: No city, town or county in the U.S. actually matches the national average. Some locales may have select material costs or labor rates closer to the national average than others, but none will align with the national averages for all the material, labor and equipment costs in the RSMeans database.
Lumber will cost less in Spokane than in San Diego, since the Northwest is teeming with timber operations. Meanwhile, labor will likely be more affordable in Boise than in Austin, since the cost of living is lower. Using the national average for either of these costs will make your estimate less accurate.
To account for this, RSMeans Data engineers obtain local labor wages and prices for key materials across the nation, then use the variances of those prices from the national average to create localization factors. These factors, housed in the City Cost Index, can then be applied to any material, labor or equipment cost in the RSMeans database. By doing so, you transform the data from the national average to a rate that’s accurate to over 370 local markets across the U.S. and Canada.
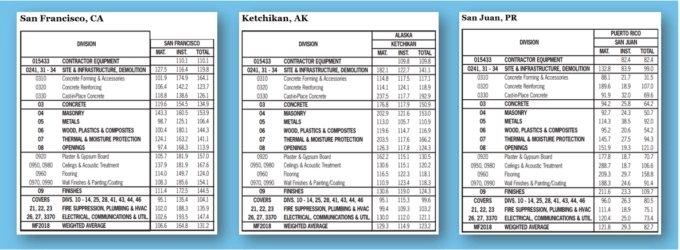
So where do you find the City Cost Index? Flip to the back of an RSMeans Data Cost Book, and you’ll see a table that looks like the one above containing localization factors for each quarter of year. Better yet, these factors are automatically applied when you select your location in RSMeans Data Online. The online platform contains the same cost data as the books, only simpler to find. But what if the project you’re working on won’t break ground for three more years? There’s a second tool that can bridge that gap.
The Long-Range Specialist: Predictive Cost Data
So you have your localized data, but the agency won’t be building its new headquarters for almost three years. That means that the data you’ve gathered for the 12 cities will be outdated by the time the project breaks ground. This is, in fact, the greatest historical challenge in the estimating world: How do you create estimates for future projects with current data? Until now, estimators had to use their best judgment. But that leads to inconsistent results. Now, however, you have access to a new specialized technology: Predictive cost data.
Predictive cost data, available in RSMeans Data Online, overcomes a historic challenge for estimators: Costing future projects with data that will be outdated by the time the project is started. But by applying econometric and data mining methods to trends found in 80 years of cost data, RSMeans Data engineers were able to build models that accurately predict future construction costs within 3% accuracy of the actual value. The result gives you the ability to estimate projects for any quarter up to three years in the future, free from the worry that your estimate will be invalid by the time the project is started.
An Intelligent, Winning Combination
RSMeans Data is a powerful tool for creating accurate estimates. But if it isn’t properly localized or if your costs are out of date, it won’t bring you the winning results that it otherwise could. When used together, the City Cost Index and predictive cost data will give your estimates a competitive edge, so you can be confident you’re fielding the most accurate estimate possible. Even if your next project happens to be the headquarters of a Federal agency.


