
The State of Facilities in Higher Education, 13th Edition
For more than a decade, Gordian’s State of Facilities report has served as a trusted constant for higher education leaders — documenting where campuses stand today while revealing the long‑term patterns shaping their future.
The 2026 edition continues that tradition.
This year’s report reflects on another year of extraordinary pressure on academic communities — marked by continued college closures, tightening resources and the growing reality of the demographic cliff. Familiar challenges remain, but the data tells an evolving story about how institutions are responding.
Introduction

This document is produced annually to reflect our understanding of what has been happening in the higher education facilities world over the past year. Accumulated over the years, this report also serves to help understand patterns and trends across a larger historical time frame. It is a repeating constant while always evolving with each iteration. It is familiar, while ever changing. Like Greek philosopher Heraclitus noted, “no man ever steps in the same river twice.”
The 2026 report is no different, with a familiar set of topics and new data telling an evolving story. The past year has been the latest of many with extraordinary stressors being placed on the operation of academic community campuses, including the tale of another 16 college closures being announced.
Gordian data reflects mixed indicators, including:
- Capital renewal backlogs are reaching a new high of $156/gsf, nearly double the $80 reported in 2007.
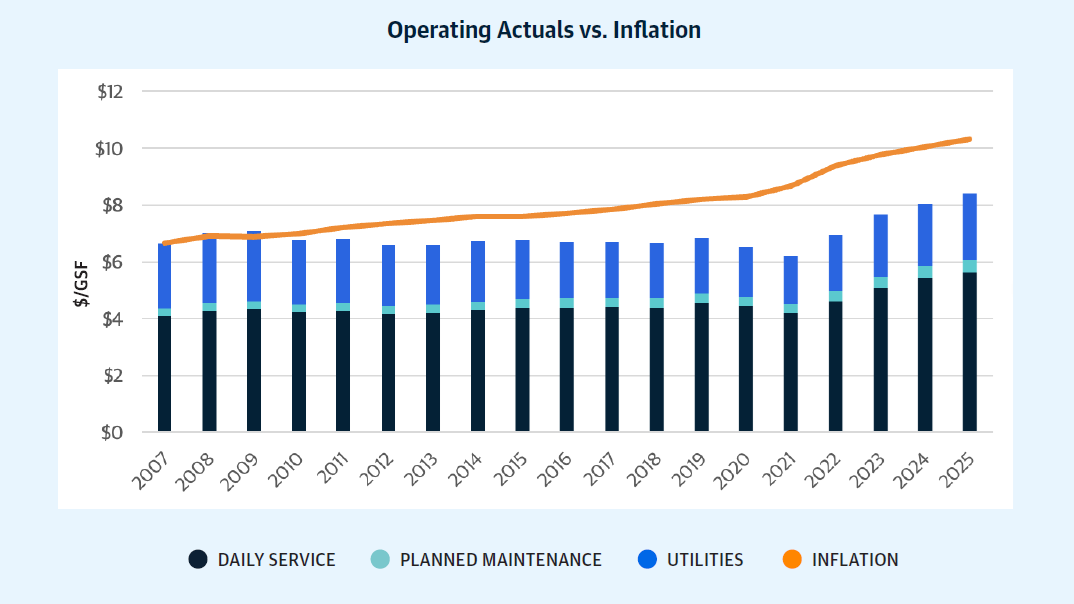
- Operating budgets made slight gains against the more moderate inflationary rates of the past year, with an 18.5% shortfall from target, slightly better than the 20% of 2024.
- Capital investment in existing buildings remains at only 73.5% of the targeted spending required to stave off the accumulation of more deferred need.
One modest upside appears to be new construction continuing a stabilizing trend (or as some might think, stagnating) as schools appear to recognize the real threat of being overbuilt for the likely community population moving forward.
This slowdown may in part be in recognition of the anticipated new challenges in 2026 from the demographic cliff, first called out by Nathan Grawe nearly eight years ago.
We intend to also spend some time talking about the idea of change and how communities are responding to both recent changes and the many changes they have been facing over time. This isn’t the first year of change, so we want to explore what educational facilities communities have learned about change, recognize some of the better ways to respond to it and consider the prospects moving forward.
Each year we reflect on what we know and take this opportunity to consider which actions will place educational communities in a position to make the best possible decisions and choices for their future. We are glad to have you join us.
In this annual report, we often remark on some familiar data themes. But every 5 years, we update our record of the construction activity happening on campuses in our database. With the close of 2025, the data has been updated and is reflected in this image with its tell-tale waves of activity. Like all human endeavors, there are surges and easings in the energy being put into the growth of campuses (we have no records of a year when there was an overall contraction in space).
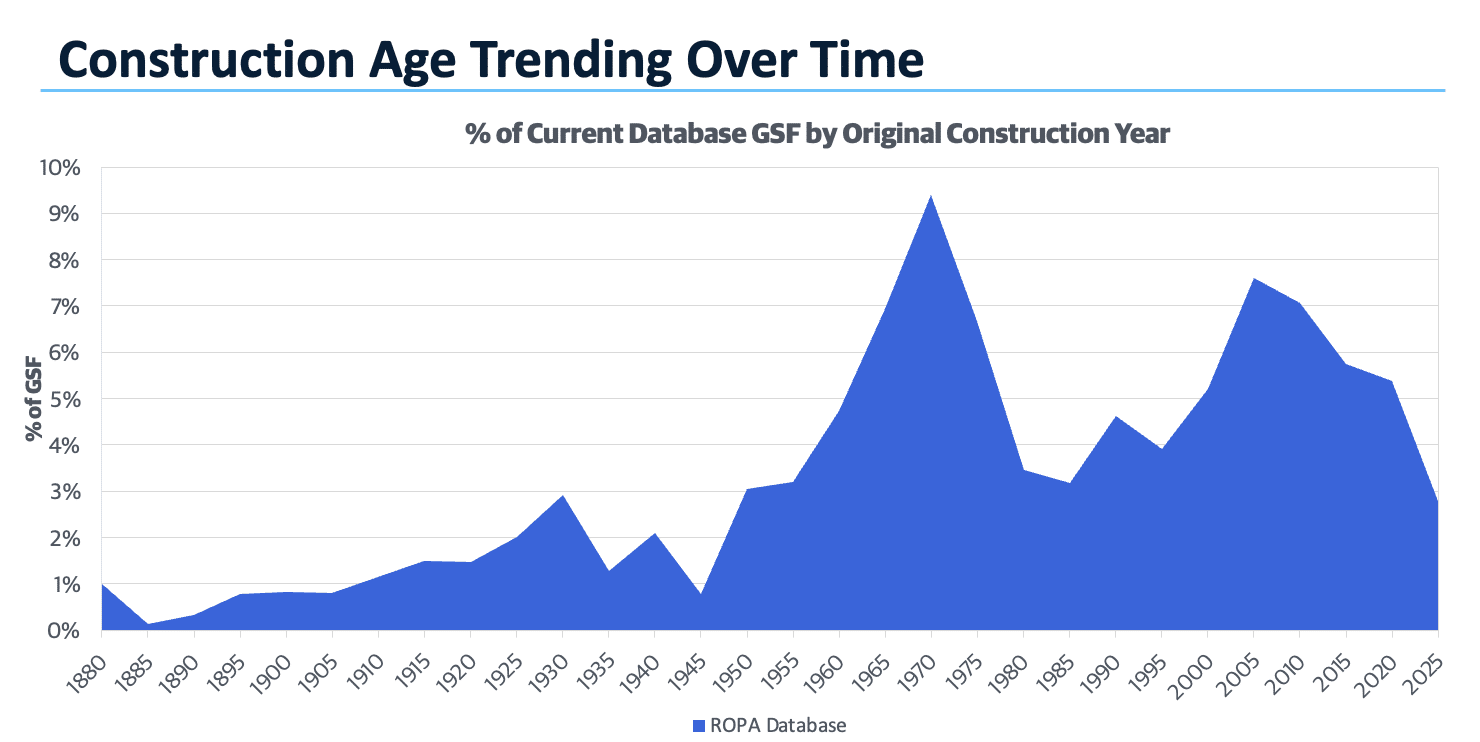
This year’s image depicts the now familiar great surge that happened post-sputnik and in alignment with the arrival of the Baby Boomers to their college years, from the mid-60s through end of the 70s. It also shows an equally oft discussed surge that happened at the arrival of this century, in some regard reflecting the arrival of a new generation onto campuses, along with the energy from a technological transformation which continues to impact all of us today.
The past five years have started to reveal a remarkable moment in the history of these campuses; overall campus growth continues trending toward zero, and we see the lowest level of new space construction in 40 years. This is not the case for all campuses of course, but in totality, some remarkable leadership on affected campuses has allowed those communities to rein in growth to match stable or shrinking student populations and commensurate levels of activity. This “right-sizing” is bold and courageous in the face of a history which has asserted strongly that not growing is dying.
If this trend continues, it may be possible for institutions to be more comfortable 1) refocusing capital resources into existing building spaces, which we will shortly demonstrate in several ways are currently underfunded, and 2) connecting new construction with the decommissioning of older buildings which are no longer meeting the expectations of 21st century educational requirements.
It is important to recognize that “no new construction” is neither realistic or desirable. Higher education has long been the home of some of our nation’s most durable structures. Still, even the most durably designed buildings will ultimately require attention and assessment about their continuing value. And some buildings have frankly stayed around longer than their useful life but their robust nature has made them hard to remove.
As Lee and Murray note in their 2025 book, “Sustainable Design for Uncertain Futures,” “…the discipline of architecture, as it is currently practiced and codified into law, fails to adequately plan for the fourth dimension – time.” A framework for designers to rethink the ways in which we conceive of design, the writing emphasizes the importance of addressing the inevitability of change and the need for adaptive capacity in the built environment.
…the discipline of architecture, as it is currently practiced and codified into law, fails to adequately plan for the fourth dimension – time.
With a great percentage of today’s higher education building portfolio not yet built to be adaptable for that unknown future, we will continue to see new buildings being built, ideally with a greater eye to this ever-changing future. And equally importantly, we will consciously and simultaneously remove structures which no longer serve the needs of these communities.
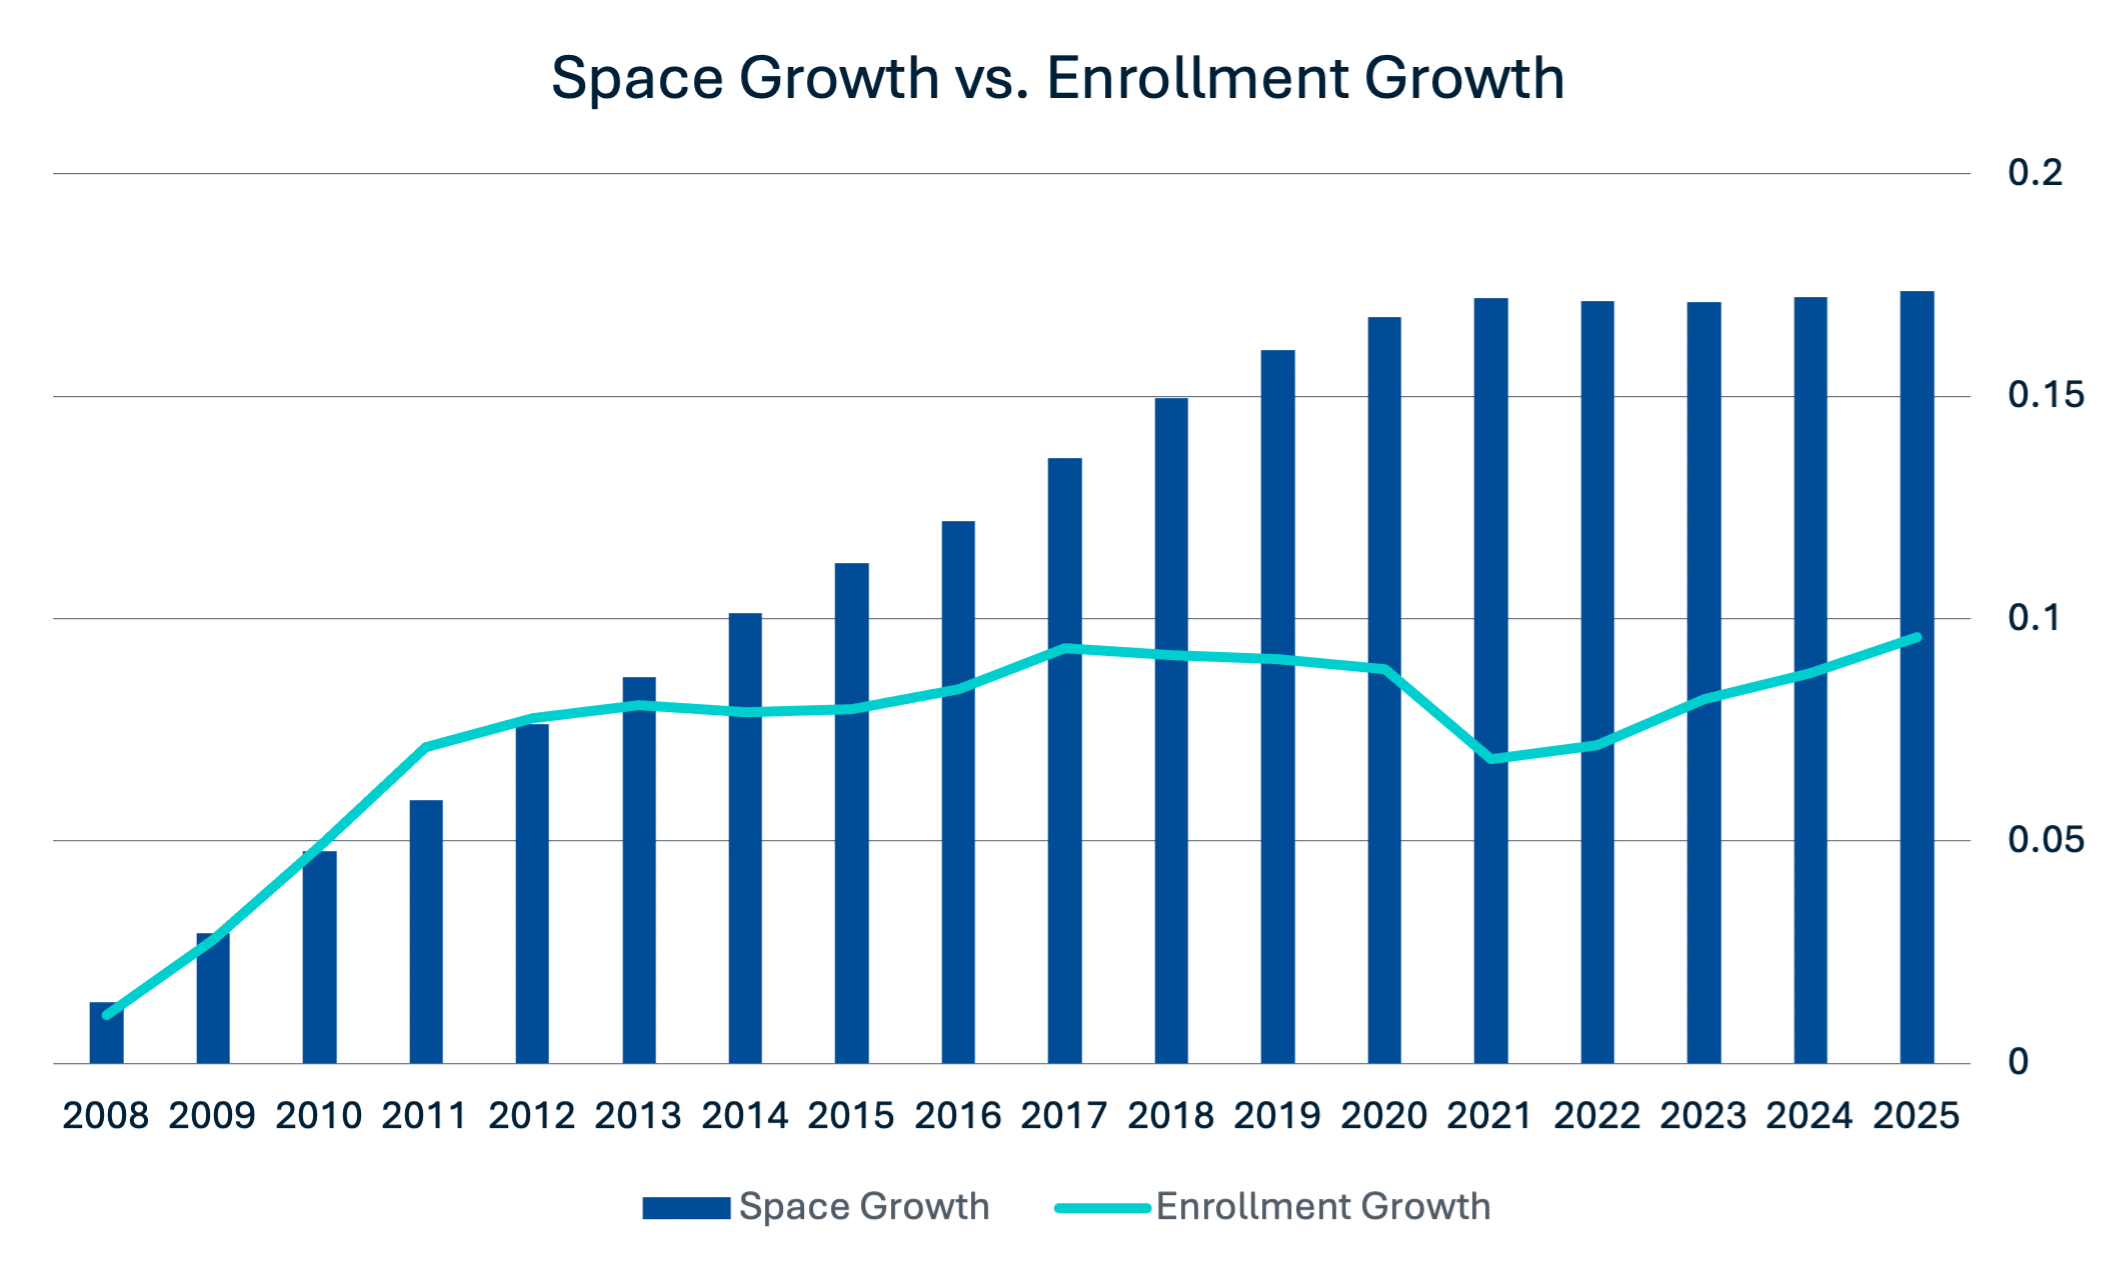
It can no longer be attributed to a blip in the data. Over the last five years, space on campuses has seen an extended pause in its seemingly inexorable growth pattern. The combination of many campuses facing stagnating or dropping enrollment patterns – along with the mounting gap between dollars required to care for existing campus portfolios and dollars available to spend – appear to be having a profound impact.
It’s not a moment too soon either. This is the year when campuses are supposed to start experiencing the decline in available students per the birth rate driven demographic cliff. Having excess space to maintain on campuses occupied by progressively fewer students will make appropriate stewardship even harder. Efforts to reduce or eliminate space are exceedingly difficult as they have always been, but putting available capital into existing buildings will at least make the money that is available go the farthest.
The refrain regarding investment of capital has been consistent for some time. Institutions have built beyond their capacity to adequately address the recurring investment that system life cycles demand.
Once again, the data indicates an increase in the amount of money being spent on existing buildings (reversing a slight downward trend last year), but not enough to close the gap with the money that would be required to keep up with the need in those buildings.
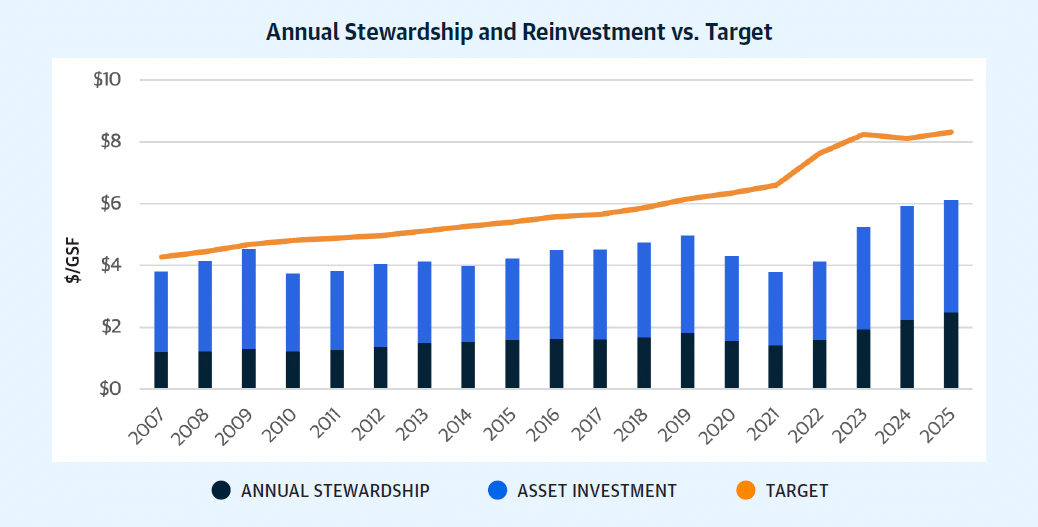
For those unfamiliar, Gordian planning teams use key datapoints about campus buildings to build a viable target for what should be expended on an annual basis to maintain existing building conditions. It does not fundamentally improve the campus, but keeps it from accumulating more deferral.
Rooted in our data and based on our experience with billions of square feet of collegiate buildings, the number is frequently less than a standard 2 or 3% depreciation figure, and reflects issues such as building age, construction materials and systemic complexity.
In this year’s document, that database-wide target has remained above $8 per square foot, while spending has finally eclipsed the $6 mark. That represents the slightest of decreases in the gap between the numbers, with spending remaining at a challenging 73.6% of target.
Given the comparatively typical inflation rates of the past year, the 3% growth in spending is remarkably close to expected inflationary increases. As schools slow their growth and investment in new construction, a rebalance toward investment in existing assets would be a welcome change. Such a transition would signal that leaders see the importance and value of caring for the properties that will be necessary to deliver the full range of programming expected in their communities. Such swings in capital investments aren’t instantaneous, and we look forward to seeing this adjustment appearing in future years’ data.
This document will continue to address deferral not as deferred maintenance but as deferred capital renewal. These dollars are not for routine activities that people often associate with maintenance, like filter and fan belt changes. They are to attend to needs in system components, and occasionally whole systems, which have reached their useful life. These are the large investments like roofs, mechanical system components and refreshes in finishes that are not annual but periodic, and each on their own schedule.
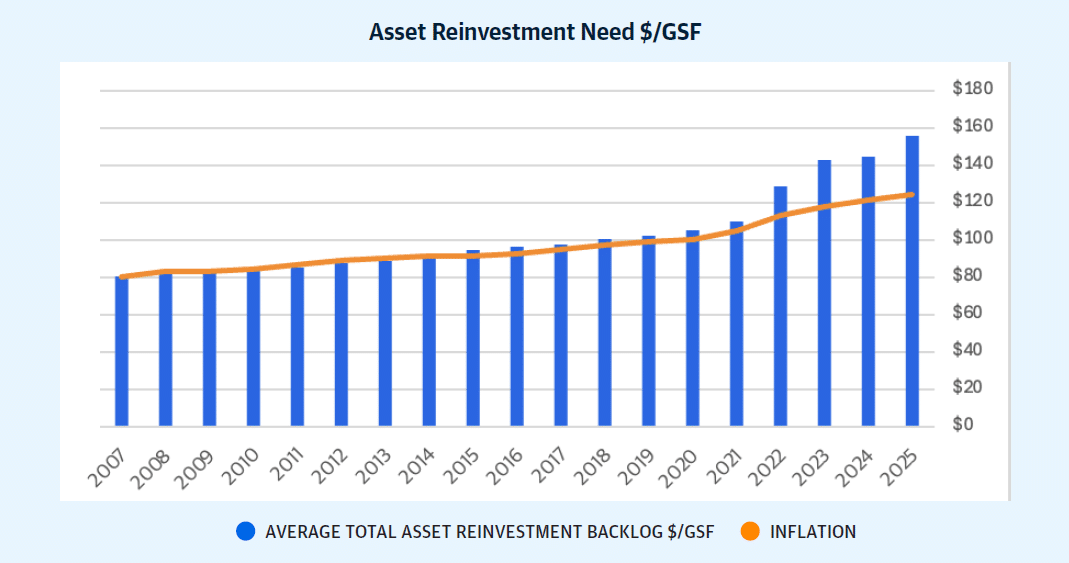
The ongoing shortfall in spending noted in the previous section on capital investment is reflected here in the continued growth in renewal need, now reaching $156/gsf. This figure surely reflects routine inflationary escalation, but a nearly 8% increase in these figures indicates that need has expanded beyond basic costs and the sustained underinvestment continues to add to the embodied debt obligation in higher education facilities.
This figure will likely accelerate upward as new construction on campuses slows, without an expansion of targeted quality investment in the existing building and infrastructure portfolio. New construction dilutes and slows the growth of this benchmark measure by regularly inserting additional $0 dollar space onto campus. Its removal from the equation reveals more directly what is happening to the existing spaces.
Campus leaders who are choosing to remove the neediest space on campus and replace it with often smaller, more flexible and more productive spaces are getting the best of all worlds. Why? They are adding $0 need spaces, removing the highest need space and often shrinking the overall portfolio to extend the reach of existing investment dollars.
But as long as schools are continuing to underinvest in existing buildings, the growth in this benchmark figure remains inevitable.
The pressures on operational spending are no less relentless than those on capital renewal investments. The drivers are somewhat different; a mix of equipment driven requirements, code stipulated demands and programmatic expectations. Many of those cannot be altered and exist in direct relationship to the portfolio that is being operated. Still, the last 19 years showed many, many years when operators have found creative ways to operate with fewer resources.
The introduction of new technologies to both monitor actual maintenance requirements and to deliver services more efficiently has been the most common. Fault detection and diagnostics has helped many campuses move away from schedule driven planned maintenance to a more targeted and often less effort intensive approach.
Robotic cleaning and grounds care have expanded the reach of existing employees even as demands increased. The pandemic also helped usher in new expectations that altered expectations and reduced the services to be delivered. Eliminating daily trash removal and cleaning services in private office spaces is one often cited example. And for much of the last decade that allowed a gap to expand between inflationary pressures on budgets and the actual dollars being expended.
Campus to campus, the effectiveness and success of these strategies is a mixed bag, with some communities being more successful than others. But they have all been necessary to cope with upward pressure on compensation and benefits as well as energy costs.
The last four years have revealed budgets acknowledging that even the most creative and talented teams cannot cope with the extraordinary post-pandemic inflation experience.
The 11th edition of this report in 2024 delved more deeply into the long standing and slowly evolving talent challenge on campuses, and really across all industries for the trades in particular. There is rarely a question about college campuses being a place to find some of the most talented people in our nation. But finding and keeping that talent in an ever more competitive environment remains a struggle.
Budget pressures have added financial constraints that limit resources for employee compensation individually and restrict the total number of people that can even be employed.
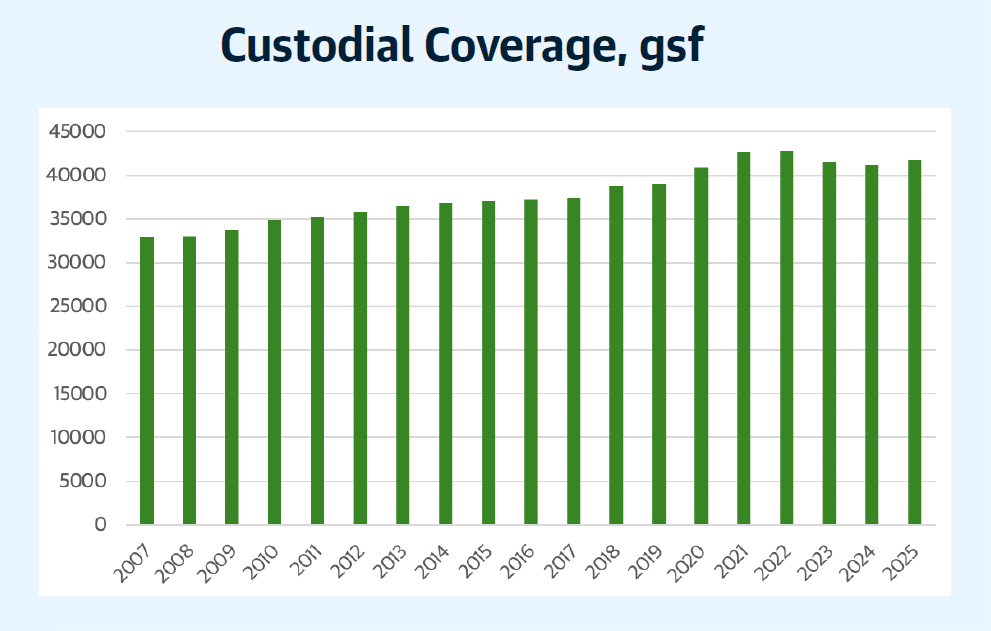
While we have often looked in this report at maintenance staffing, such trends are evident here as well in the upward increase in the amount of gross square footage that custodians are being asked to care for daily across campuses. Space demands have grown less than 1.5% since 2024, about the yearly average leading to a substantial 27% since 2007.
The pandemic brought on unsurprising expansion of space demands, as schools struggled to manage the pressures from budget and turnover. A return to the original expansion trend resumed after employment stabilized and a new understanding of what levels of service would be acceptable moving forward.
Some noteworthy differences are evident between public and private institutions. For one, private institutions have expanded space coverage to be today at slightly more than where they were back in 2007. And while the overall shape of the curves are similar, there is a steeper increase happening for public institutions, with an 19-year growth in coverage area of 28% compared with 17% for private institutions.
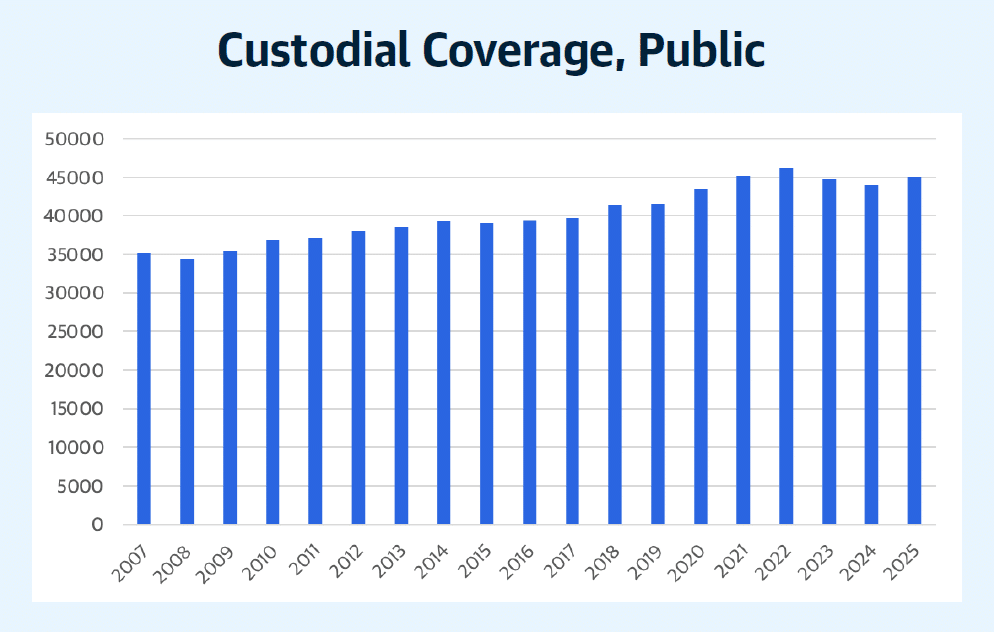
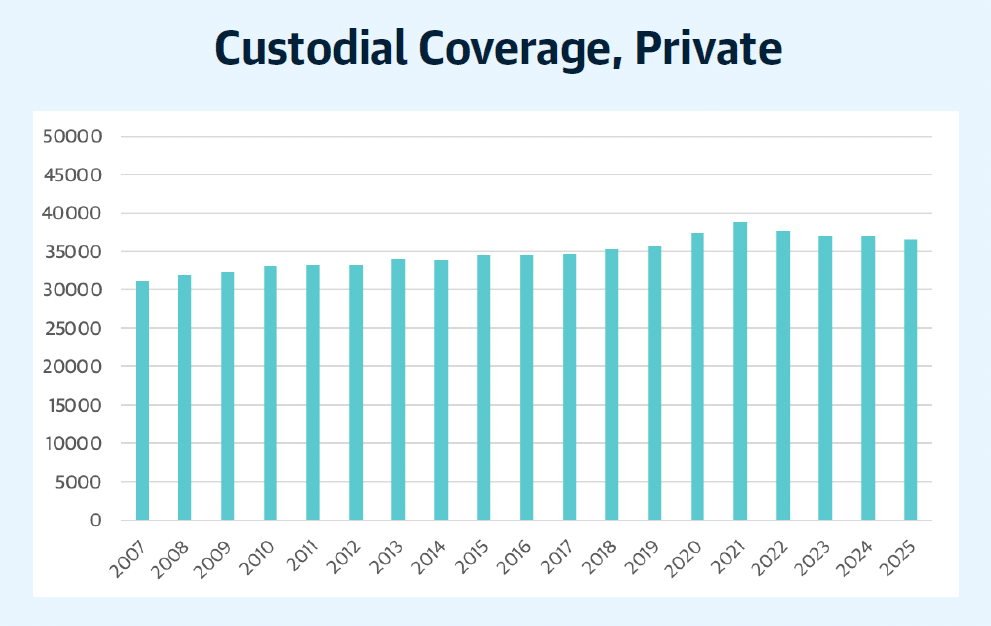
This overall difference may be attributable to any number of factors on a given campus, including cleaning expectations, size of buildings (fewer smaller, fussier spaces allows for larger equipment and faster movement with simpler logistics), building conditions (newly renovated buildings are easier to care for than tired ones), financial resource availability and even which entities are involved in making those resources available.
Efforts to reduce energy consumption on campuses over the past 19 years have been driven by a number of motivations, most notably carbon reduction, sustainability and/or cost savings. Year-to-year volatility can also be as much a function of local weather and broad climate driven influences as it is a measure of managed efforts to control use. Still, the long-term trend is unmistakable.
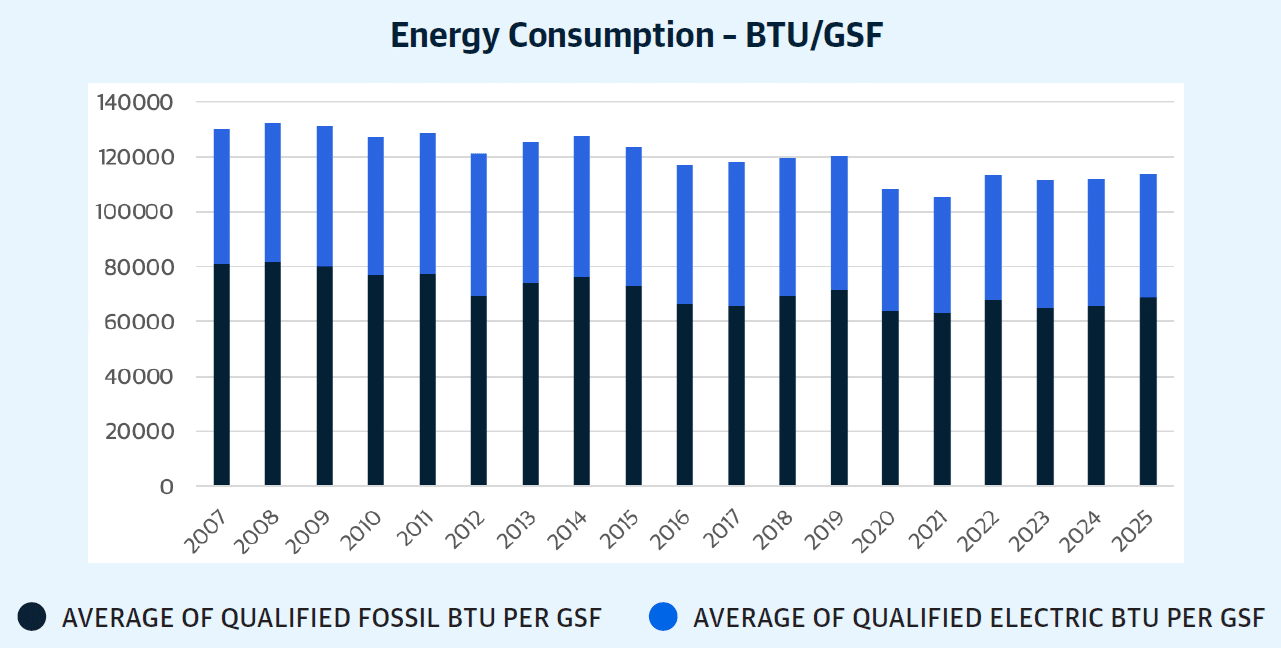
Energy consumption per gsf is down 13% from 2007 levels across all schools in the database, from more than 130 thousand btu/gsf to about 114 thousand in 2025. This is a laudable reduction given the ever increasing presence of energy intensive activities and the extraordinary level of connectivity that students bring to campuses.
More efficient building controls, tremendous changes in lighting systems, improvements in major heating and cooling systems, enhanced digital modeling in research and even the introduction of awareness and incentive programs have all contributed to a transformation that sees energy use falling. These will continue to compete with inverse pressure, such as more schools farther north in our country contemplating adding A/C to student residential
buildings.
It is worth noting that overall energy use didn’t drop as much as one might expect in 2020 and 2021 during the pandemic. The basic operation of campuses today to keep buildings from freezing in winter or developing mold in the summer represents an even greater percentage of usage as faculty, staff and students actively work to reduce their active consumption.
When campus occupancy was significantly lower during the earliest parts of the pandemic, basic campus operations still demanded significant energy consumption. When populations returned but the virus was still not under control, extra ventilation and filtration in conjunction with the dispersing of activities across campuses meant energy use actually expanded for a great percentage of spaces on most campuses. The presence of hybrid classrooms and some campuses being slower than others to return to full occupancy helped our database as a whole stay slightly down in energy use.
Campuses today continue to experiment with newer technologies, explore the introduction of AI to help identify opportunities and optimize equipment operation, as well as simply transfer the overall responsibility for primary energy operations to third parties. As demand for energy use in the marketplace continues to expand and downward pressure increases on energy supply, this area will be one we continue to watch closely.
Collegiate environments are renowned, even disparaged, for their reluctance to change. The slow pace of faculty shifts, the permanence of the physical environment, the drag of alumni expectations and even the challenge to overcome reputational standing are all marks of stasis.
“Know what’s weird? Day by day, nothing seems to change, but pretty soon… everything’s different.”
— Calvin from Calvin and Hobbes, Bill Watterson
But in fact, change has always been very evident in education. Students come and go every four to six years. That’s about the average tenure of presidents and chancellors as well, coming in at 5.9 years in 2023. Until very recently campuses have seen rampant growth, as for much of the past 70 years schools have been steadily increasing in size and population. Budgets are routinely going through a cycle of austerity and then surplus, with sources of funding constantly shifting, though most inside the communities are likely to remember austerity as the dominant condition. The pandemic showed everyone that academic communities could pivot dramatically in a matter of weeks, and the way in which students think about place, community and the classroom has been evolving ever since. That change was largely empowered by the technology that has been transforming education for decades now, and will continue to do so with the astonishing rate of artificial intelligence driven change that we reported on last year and will note again this year. All of those changes have continued to be prominent areas of conversation on campuses over the past year.
If change is not an anomaly but the norm, then it begs the question whether campus leaders are aware of the change that is happening to them and if they are actively addressing the impact it has on their communities. So in January and February of this year we surveyed people with facilities stewardship responsibilities about those questions, and more. We found both expected and provocative responses.
The least surprising finding is 77% of responses indicating that over the past one to five years they have experienced more than typical or a significant amount of change. Another 21% said that they were experiencing typical change. Change has clearly been part of the reality of higher education facilities leaders.
Survey Respondent Data
Slightly over 20% identified as Chief Facilities Officers. About 75% play a variety of other leadership roles inside facilities, planning, sustainability and construction offices. And the final 5% are in offices across the institution, such as finance, provost, housing or student life. None of the 9 regions of the country we designated has more than 20% of the responses and all are represented. Just shy of 70% of the respondents said their institution’s highest degree was a doctorate. For student population, 42% of respondents reported between 4,000 and 20,000 students, with 17% reporting smaller population, and the remaining 40% larger.
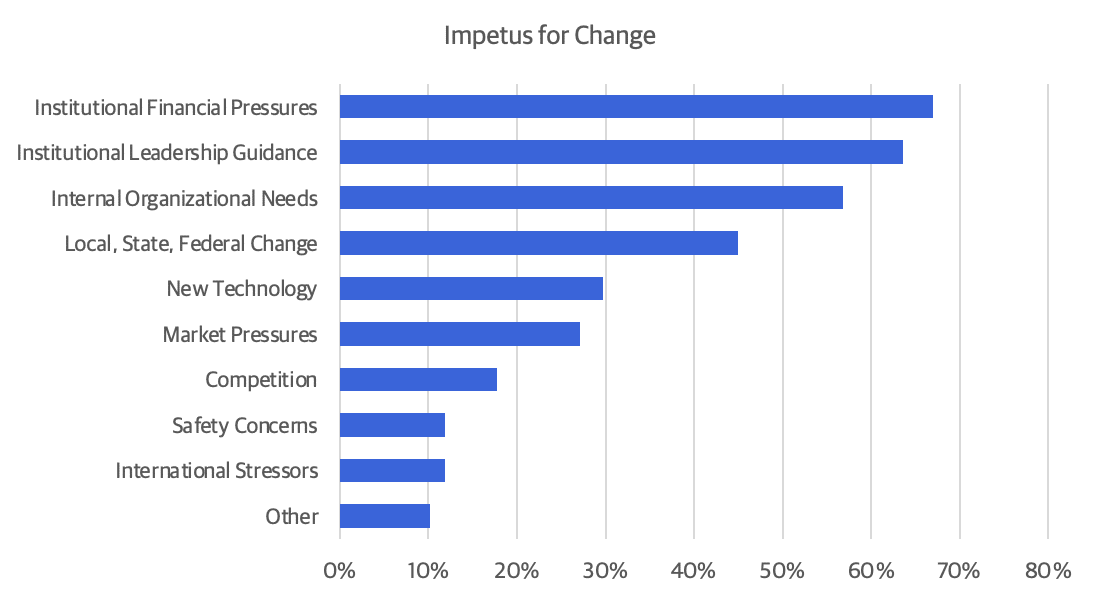
A great challenge with change is that the impetus for it can come from a wide variety of sources outside and inside of our worlds, and those sources can be acting simultaneously. That is also the case for our respondents.
Given the opportunity to respond to more than one driver, the replies emphasize a mix of institutional, departmental and external pressures. Other drivers fall away quickly, though technology is noted surprisingly frequently as it can serve as much as a solution to change pressures as it can be a driver of change in and of itself.
While the kinds of changes we often think about as transformative are sudden and dramatic, Bill Waterson’s character Calvin notes that change is happening all the time and as life moves forward, we are changing whether we are trying to or not. Change is therefore a reality which people and organizations should be managing as part of the course of regular business. The question, then, is not if but how leaders respond to it.
In the introduction to his book “Master of Change,” Brad Stulberg lays out very clearly the difference between homeostasis and allostasis. Homeostasis, a concept conceived earlier but named definitively in 1926 by scientist Walter Cannon, is defined as the tendency of living systems to resist change in order to maintain stable, relatively constant internal environments, embodied in a cycle of order, disorder and order, as the systems seek to return to an original stability.
Systems, human or otherwise, are constantly fighting and resisting destabilizing forces and want to return to their stable position. It’s a great concept until the world around us no longer recognizes the value of the original stable position.
Stulberg goes on to tell the tale of Peter Sterling and Joseph Eyer, two researchers at the University of Pennsylvania in the 1990s who observed that healthy systems do not actually resist change. With the newly crafted term allostasis, they point out that healthy systems adapt to change, moving forward with grace and grit, in a pattern of order, disorder and reorder. Sterling and Eyer are quoted as saying, “We achieve stability through change.” And Stulberg poses the idea that this phrase has a double meaning — that “the way to stay stable though the process of change is by changing, at least to some extent.”
There is not a better example of this last idea than academia’s response to the pandemic. Prior to March 2020, there had been a long history of stability in collegiate education that yielded tried and true practices (or patterns) from how ideal campuses were physically organized, to what was expected in the durability of those spaces, what going to class looked like, and what kinds of criteria made student gathering successful. No two campuses were the same, but almost all seemed to operate on similar assumptions and arriving on any one of them felt quickly familiar and comfortable. By the end of that March, most of those campuses were empty.
The entire planet was shut down due to Covid-19, and to move forward in that moment, everything about how people engaged and did business had to change, at least for a while. The growth of Zoom from 10 million to more than 300 million users in a matter of months was in part powered by the transformation of education at all levels across the country to an online format. Educators who had resolutely resisted the transformation to an online experience were quickly discovering that while imperfect, some variation of their teaching practices could continue, and the change in fact came with some fun, unexpected benefits like teaching in slippers, proximity to their coffee makers, and a much shorter commute on hot and humid or snowy mornings. It would be the better part of two years, before things returned to something approaching normal across all of higher ed, but it is a very new normal.
Students already transitioning to a flipped classroom expected even more content to be available online, and everyone now understands there are viable ways to make remote and even asynchronous teaching and learning effective as part of a curriculum. There are still strong indications that students want to be together on campus for the many, many living and learning experiences that they have outside of the classroom, but meetings with peers and colleagues can happen remotely when necessary to allow for more flexible gathering and more individual freedom. Faculty and staff can do some of their work remotely and the role of the individual office is changing. Meetings even happen with regularity via an online platform among people already on campus simply to save commute time.
Campuses by and large ARE less visibly active as noted by any number of campus facilities leaders and it has all started to change the way we think about office, classroom and general gathering space needs. Communities still want to be together, but they come together now in new and different ways. Order, disorder and REORDER.
If the idea of allostasis is in fact the right way to think about change, then it means we are always in a state of change and must not just respond to change when we notice it, but in fact be thinking about change preparedness all the time.
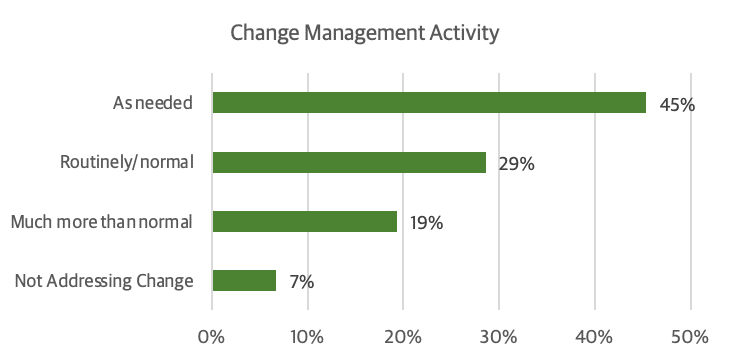
Our survey indicates a mixed bag in this regard for facilities leaders. When asked whether asked whether leaders were actively addressing the pressure that change places on their organizations through training or targeted programs, 29% indicated that they were doing it routinely. And 19% were actively doing more than normal right now. But 45% indicated only responding to change as needed, and a further 7% were not doing any work in this regard. While change is clearly all around us, the ability to drive toward active management is less widespread than it could be.
Our research pointed us to a long list of viable change models, including Adkar, Bridges Transition Model, Deming Cycle, Kotter’s 8 step, Kubler-Ross Change Curve, Lewin 3 Stage, Maurer 3 Levels, McKinsey 7-S, Nudge Theory and Satir Change Model.
When asked about these change models, 10% indicated preference for particular models, while roughly even numbers of the rest said either that they relied on HR for guidance or had no particular change models to guide this organizational work. Survey respondents resonated most with our queries about Deming, Bridges and Kubler-Ross, though we also heard support for additional models including Lean Process/5S, Covey, and the 4 Pillars of Change Management.
None of this is intended to recommend a particular model. It is meant to encourage exploration of models to understand those that are most beneficial for your institution’s particular needs in this moment. There are countless tools to be employed and surely one intentional model can be successful in helping your organization address, overcome and even leverage moments of change.
Stanley Middleman, author and Forbes contributor working in the financial industry, suggested in his August 14, 2024 article for Forbes that there are several critical lessons he has learned for successfully navigating change:
- Count on the plan changing: Change is an inevitability, a guarantee.
- Hone your foresight: Leaders must be observant about trends within their business and in the market.
- Check your ego: It’s your job to prepare for risks, known and unknown.
- Opportunities in disguise: Unexpected changes are the catalyst for new opportunities.
These ideas aren’t forced into an easy mnemonic. But they do resonate with anyone who has successfully confronted any challenge which would ultimately drive a change in the way business had been done, or life had been lived, before.
The best facilities leaders learn to expect that things won’t go according to plan. It’s what Stuhlberg in his book calls “rugged flexibility.”
Also in his book, Stulberg calls out the first noble truth of Buddhism, dukkha satya, or the truth of dukkha. In short, dukkha translates to “hard to face.” It’s the truth that the world is full of things that will be hard to face; a notion about which few will disagree. In this same section of the book he relates through concepts like tragic optimism that, “If you expect and predict life to be hard, then you won’t be surprised when it is — which in and of itself makes life easier and also improves your chances of finding equanimity and meaning amidst change and struggle.”
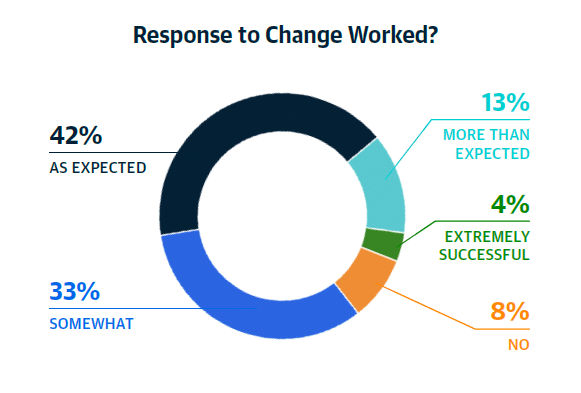
Knowingly or not, it is perhaps these ideas that at least unconsciously underpin the findings of our survey question on whether the respondents’ efforts to address change facing their organization have been successful.
Knowingly or not, it is perhaps these ideas that at least unconsciously underpin the findings of our survey question on whether the respondents’ efforts to address change facing their organization have been successful.
Addressing challenges is hard when they are fixed and finite. Ask any superintendent on a complex project! But the very nature of changes is that they continue to evolve. And so do the people experiencing them. It’s a highly dynamic situation. It is not surprising then that even with the efforts, addressing change isn’t extremely effective. In fact, nearly half felt the response efforts worked as expected, with another 17% saying it worked better than expected, indicating that leaders are finding success amidst the efforts that they are making.
AI Changes, Too
In the 2025 edition of this report, we explored where AI was headed, the hurdles in adoption to date for facilities leaders and some examples of facilities leaders who were pressing forward to create AI tools that would allow them to accelerate important changes on their campuses. AI continues to evolve and change at breakneck pace.
On February 5th, 2026, Open AI released GPT-5.3 Codex. In the technical documentation, they noted that this was the first model that was instrumental in creating itself, using early versions to debug training, manage deployment, and diagnose test results and evaluations for this new one!
“The Facilities group has become much more of a team, all pulling together in the same direction.”
— David Gingerella, Vice Chancellor for Administration & Facilities, U Mass Dartmouth
Dario Amodei, the CEO of Anthropic (creator of Claude) said in January 2026 that “AI is now writing much of the code at Anthropic” and we “may be only 1-2 years away from a point where the current generation of AI autonomously builds the next.”
Change is now.
We conclude with an observation that in a review of the comments made following various questions in the survey, the word cited most often was “team.” It’s fitting for facilities leaders who will continue to face changes. They understand that no work accomplished is done alone, that no changes are confronted in isolation, that no solutions are crafted unilaterally and no success is possible without the team of which they are a part.
There are likely no people better positioned on a campus to understand and address change than the facilities team. Between external pressures, internal business dynamics and the ever-present reality of a physical environment that requires continuous attention, change isn’t a periodic event, change is the day-to-day reality.
Share this: