

Construction Cost Insights Report: Q4 2023

Executive Summary
In the wake of the unprecedented disruptions caused by the global pandemic, the construction industry finds itself grappling with a challenging confluence of factors that have significantly impacted the pricing dynamics of essential materials. Since the onset of 2020, construction material costs have been on an unrelenting ascent, propelled by a perfect storm of shortages and supply constraints brought about by COVID-related shutdowns. As the industry endeavors to regain its footing and return supply levels to some semblance of normalcy, a new contender has emerged in the form of inflationary pressures, casting a long shadow over pricing stability. Virtually every product category, from the fundamental to the specialized, has felt the ripple effects, prompting industry suppliers and manufacturers to implement sweeping price adjustments. This unanticipated surge in costs has compelled the construction sector to confront the specter of unpredictable and volatile escalations, demanding strategic adaptation in an evershifting economic landscape. In this report, we delve into the multifaceted factors driving these price fluctuations and explore the strategies industry stakeholders are employing to navigate this complex terrain.
Amidst a rapidly changing construction environment, industry leaders have identified key trends and pain points in material pricing and supply chains as we made our way through 2023.
PCL Construction’s Contracts and Customs Coordinator Michael Streit, and Eric Orquiola, PCL’s Director, Preconstruction and Estimating, have identified critical challenges in finished product delivery, stemming from shortages in commodities and labor. These bottlenecks, they assert, have led to project delays, underscoring the pervasive impact of supply chain disruptions. Tom Park, Vice President, National Strategic Supply Chain for Skanska USA Building, highlights three major pain points in the commercial construction supply chain: electrical distribution equipment, HVAC equipment and standby power generators. According to Park, unprecedented demand, compounded by prior COVID-19 supply chain disruptions, has resulted in historic backlogs and price increases. These challenges are echoed by regional builder Webcor (based in California) whose team of supply chain subject matter experts notes that material escalation and lead times have been significant concerns. Factors like the pandemic, rising interest rates, geopolitical events and adverse weather conditions have all contributed to these issues.
Adam Raimond, Gordian’s Construction Index Manager, concurs, further sharing that supply chains and material availability remain a challenge even though the notion is that the supply lines are clear. He says, “We’re still dealing
with significant backlogs for equipment, especially in mechanical, electrical and plumbing equipment categories.”
Raimond further notes that the historic droughts in both the Mississippi and Panama Rivers, which are both critical shipping corridors, are extending lead times in a lot of material and equipment categories, leading to increased pricing as well.
In the big picture, though, material prices for construction have remained relatively steady in the last year, but price trends have been more variable if we zoom in on specific items. For example: while prices for three materials — structural steel, framing lumber and conduit — have all decreased by over 10% relative to one year ago, in the past three months, prices have slightly increased for all three. Based on these most recent trends, the Gordian team believes pricing for these items should not see much variability in the coming months.
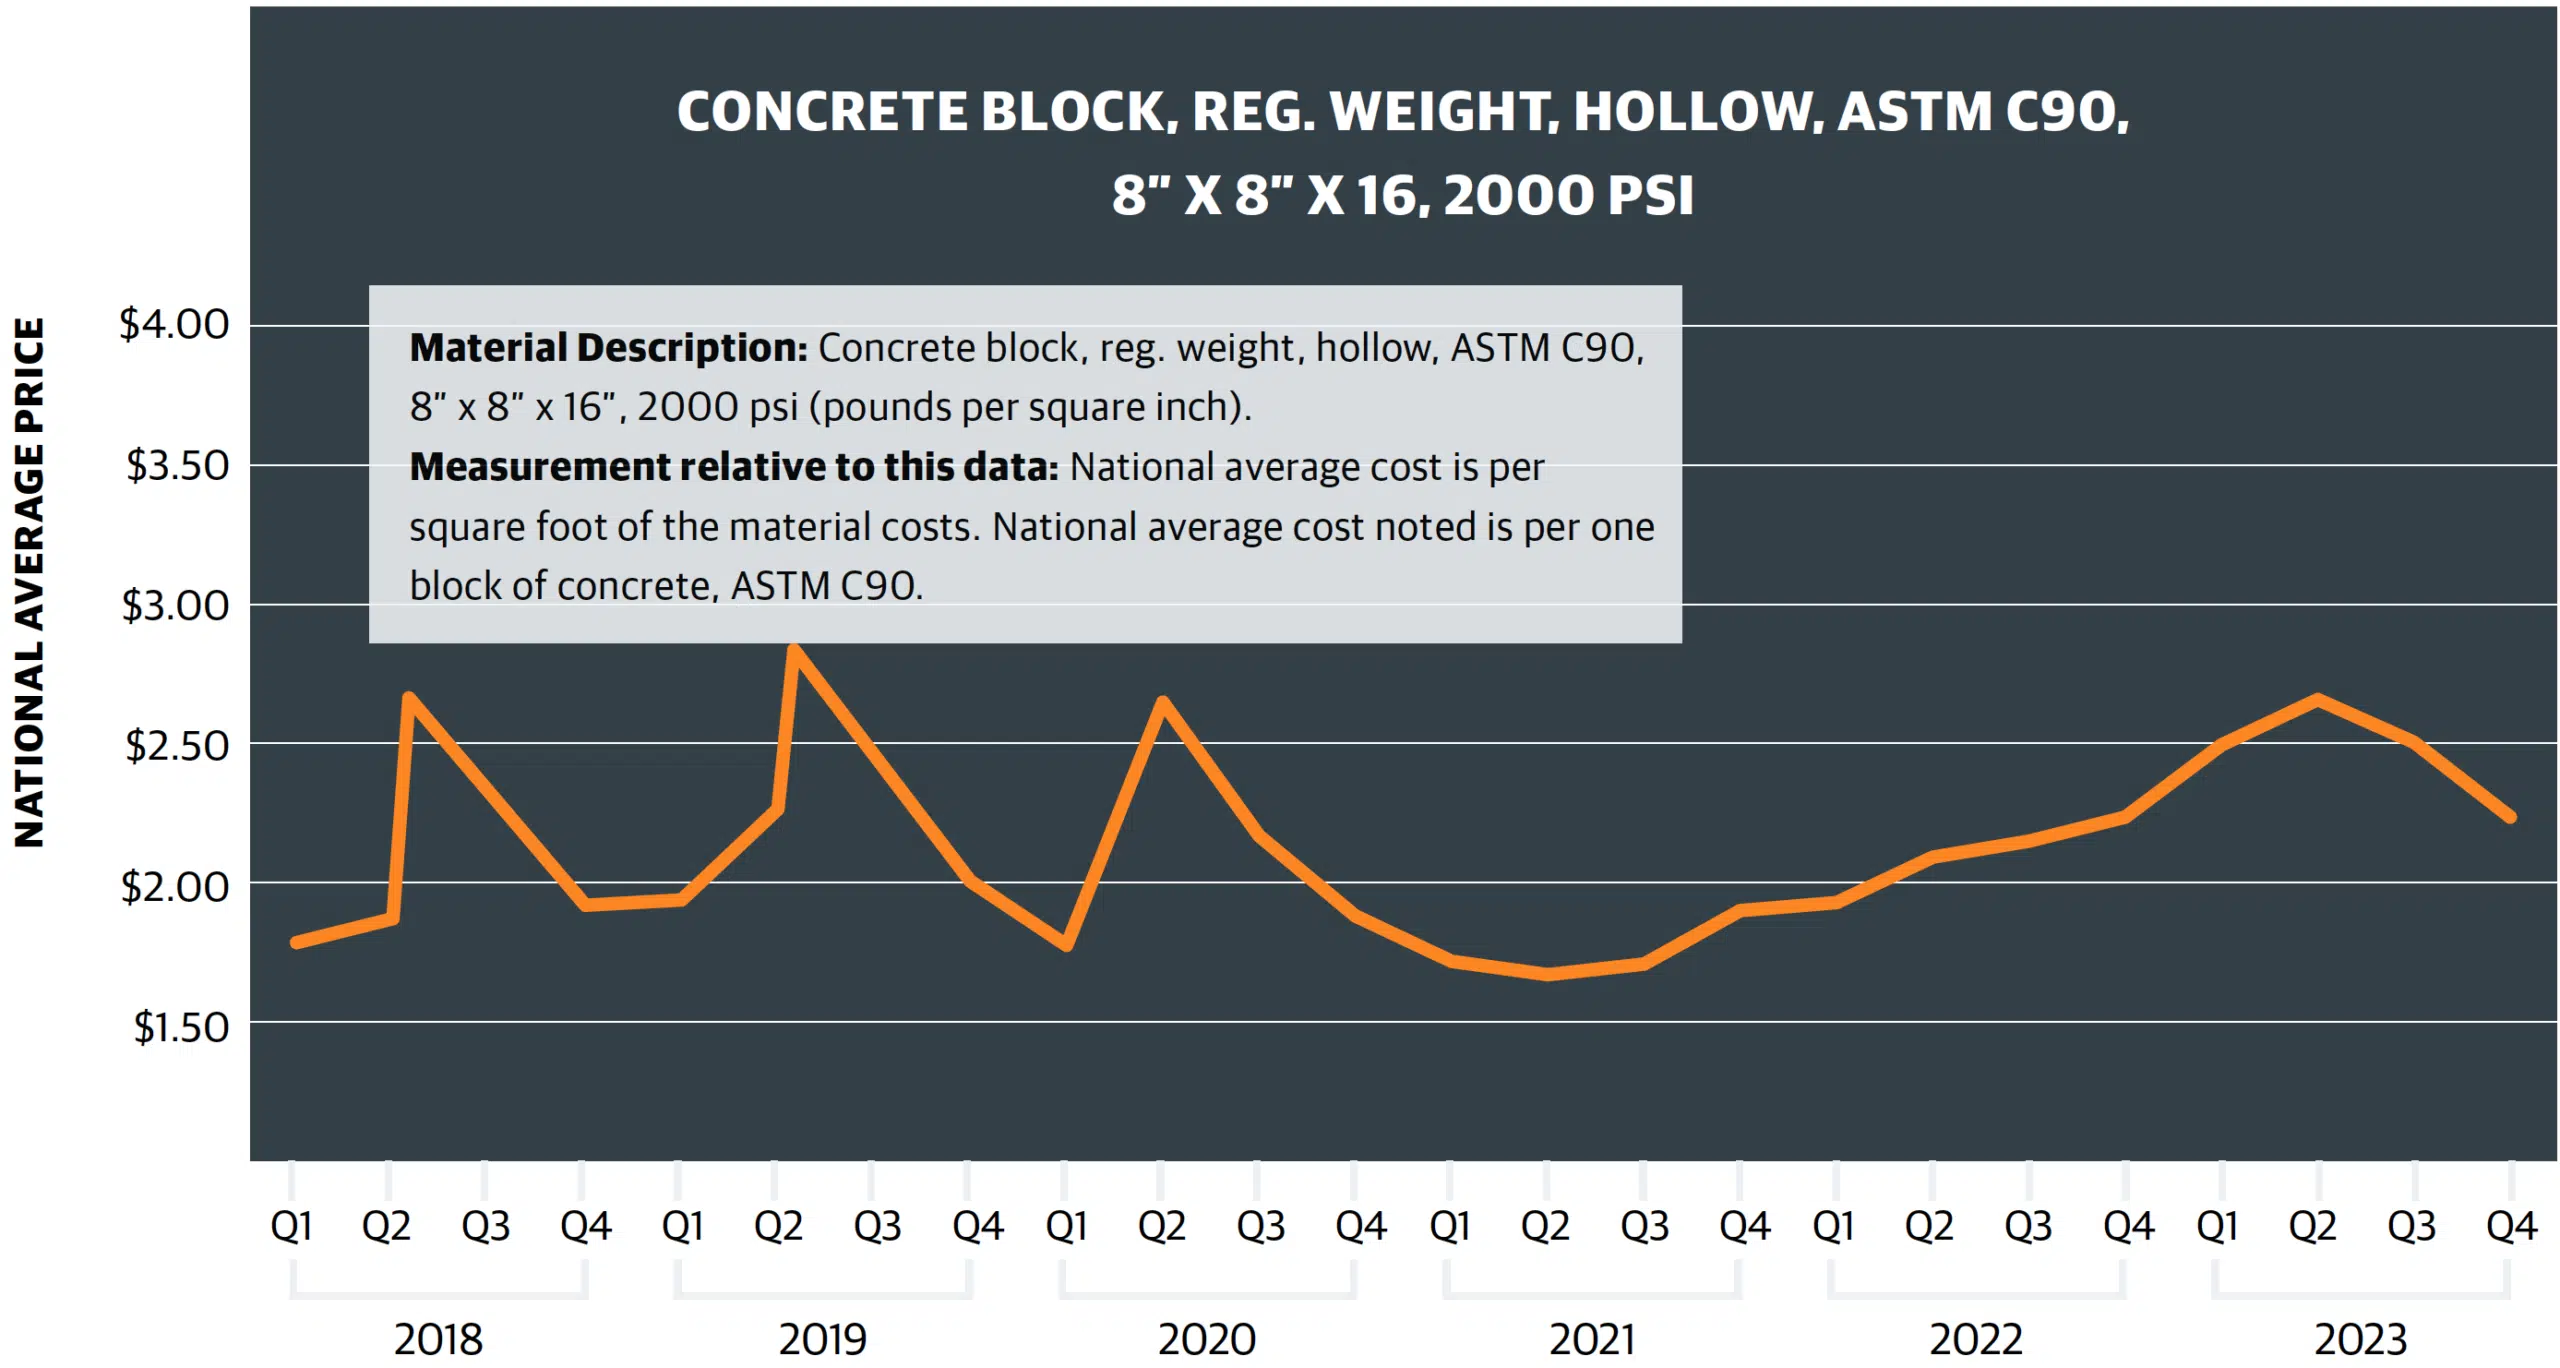
Pricing for concrete blocks also decreased slightly over the previous year, but there was a 20% increase in prices in some areas during the summer, due to some stores having complications with their suppliers.
In contrast, prices for fiberglass insulation have risen continuously in the previous year, going up over 20% year-over-year. This is likely to continue, in part due to credits families can claim for adding and installing new insulation in their homes from the Inflation Reduction Act.
Building Models Used To Calculate Price Data
Gordian’s data team researches material, labor and equipment prices and quantities in cities across the U.S. and Canada to create a composite cost model, which is weighted to reflect actual usage in the building construction industry. To capture the types of construction activity typically performed across North America, researchers merged nine building types, which represent those most commonly found across America and Canada. They are:
1. FACTORY (one story)
2. OFFICE (two to four stories)
3. STORE (retail)
4. TOWN HALL (two to three stories)
5. HIGH SCHOOL (two to three stories)
6. HOSPITAL (four to eight stories)
7. GARAGE (parking)
8. APARTMENT (one to three stories)
9. HOTEL/MOTEL (two to three stories)
Harnessing cutting-edge technologies and taking specific approaches to revolutionize the way they navigate the complexities of procurement and pricing are top priorities for industry heavyweights. PCL, for example, has leveraged innovation through their Commodities Dashboard, which taps into a reliable API data source. This dashboard empowers users to closely monitor commodities market data, providing a valuable tool for making well-informed pricing and procurement decisions. Skanska, meanwhile, has pioneered custom-built data tools, creating project specific and enterprise-wide dashboards. These tools have revolutionized communication, problem-solving and efficiency in design and construction. One standout tool is the Lead Time Dashboard, which uses data analytics to manage supply chain volatility, enhancing cost and schedule predictability. Webcor prioritized procurement, conducted extensive research, and emphasized communication across job sites and departments. The company also separated material escalation tracking and leveraged near-shoring for procurement needs.
How National Average Material Costs Are Determined
Gordian’s team contacts manufacturers, dealers, distributors, and contractors all across the U.S. and Canada to determine national average material costs. Included within material costs are fasteners for a normal installation. Gordian’s engineers use manufacturers’ recommendations, written specifications, and/or standard construction practice for size and spacing of fasteners. The manufacturer’s warranty is assumed. Extended warranties and sales tax are not included in the material costs.
Note: Adjustments to material costs may be required for your specific application or location. If you have access to current material costs for your specific location, you may wish to make adjustments to reflect differences from the national average.
Forecasts suggest that overall construction-related material price increases are stabilizing to more historical levels of 3% to 5% for most categories. However, electrical gear and HVAC equipment remain outliers, poised for continued escalation due to surging demand and constrained manufacturing capacity. The industry is also witnessing a shift away from offshore suppliers, particularly from Asia, in favor of more reliable and stable sources.
It is expected that nearly every material category will reach a “normal” rate of price change in 2024. Many items have already reached a point where their prices are experiencing little variation within a three-to-six-month period compared to 2022. However, Gordian’s Raimond notes that exceptions to this trend include concrete and gypsum, which continue to witness increases, and lumber, which either remains stable or experiences decreases, depending on the region.
Observing the pricing trends for raw, heavy materials, it becomes apparent that regional cost pressures continue to play a significant role. Concrete, gypsum and asphalt are particularly affected. The transportation costs associated with these commodities, due to their weight and specific production locations, contribute to higher prices in certain regions compared to others.
Experts from Gordian echo these findings. Construction Dive recently published their insights, stating that although the industry is currently experiencing a downturn from the historic pricing peaks of 2022, increasing demand for construction will likely sustain materials and labor pricing through 2024 and 2025. Sam Giffin, Director of Data Operations at Gordian, remarked that while concrete is projected to decrease by 1% to 2% annually until 2025, materials like wood, plastics, composites, plaster, gypsum and thermal protection are expected to see average annual increases of up to 6.5% during the same period.
In This Quarterly Construction Insights Report:
In this Quarterly Construction Cost Insights Report, we will be examining key data points surrounding construction material pricing. We will look at the Historical Cost Index, offering a retrospective lens on pricing trends, and the City Cost Index, providing a granular view of localized market variations. In addition, we will thoroughly explore the pricing trends of six key building materials:
- Structural Steel
- Framing Lumber
- Concrete Block
- Conduit
- Copper Electric Wire
- Fiberglass Insulation
Adapting to a shifting landscape: In this unprecedented era, the construction industry faces formidable challenges, with the surge in material prices since 2020 reshaping the industry’s dynamics. As supply levels return to normal, the threat of inflationary pressures looms large, necessitating strategic adjustments. Lead times, especially for critical components, remain a point of concern, demanding meticulous planning and forward-thinking.
Harnessing innovation: Innovation emerges as a potent weapon in this battle for stability. PCL and Skanska’s data-driven tools provide crucial insights, empowering stakeholders to make informed decisions. Webcor’s
strategic shift towards procurement and enhanced communication underscores the industry’s resilience and adaptability.
Charting a resilient future: As the construction sector looks to the future, cautious optimism still reigns. While challenges persist, a proactive approach to procurement, strategic use of data analytics, and a keen eye on emerging trends will pave the way forward. Through innovation and strategic adaptation, the construction industry is poised to not only weather the storm but emerge stronger and more resilient than ever before.
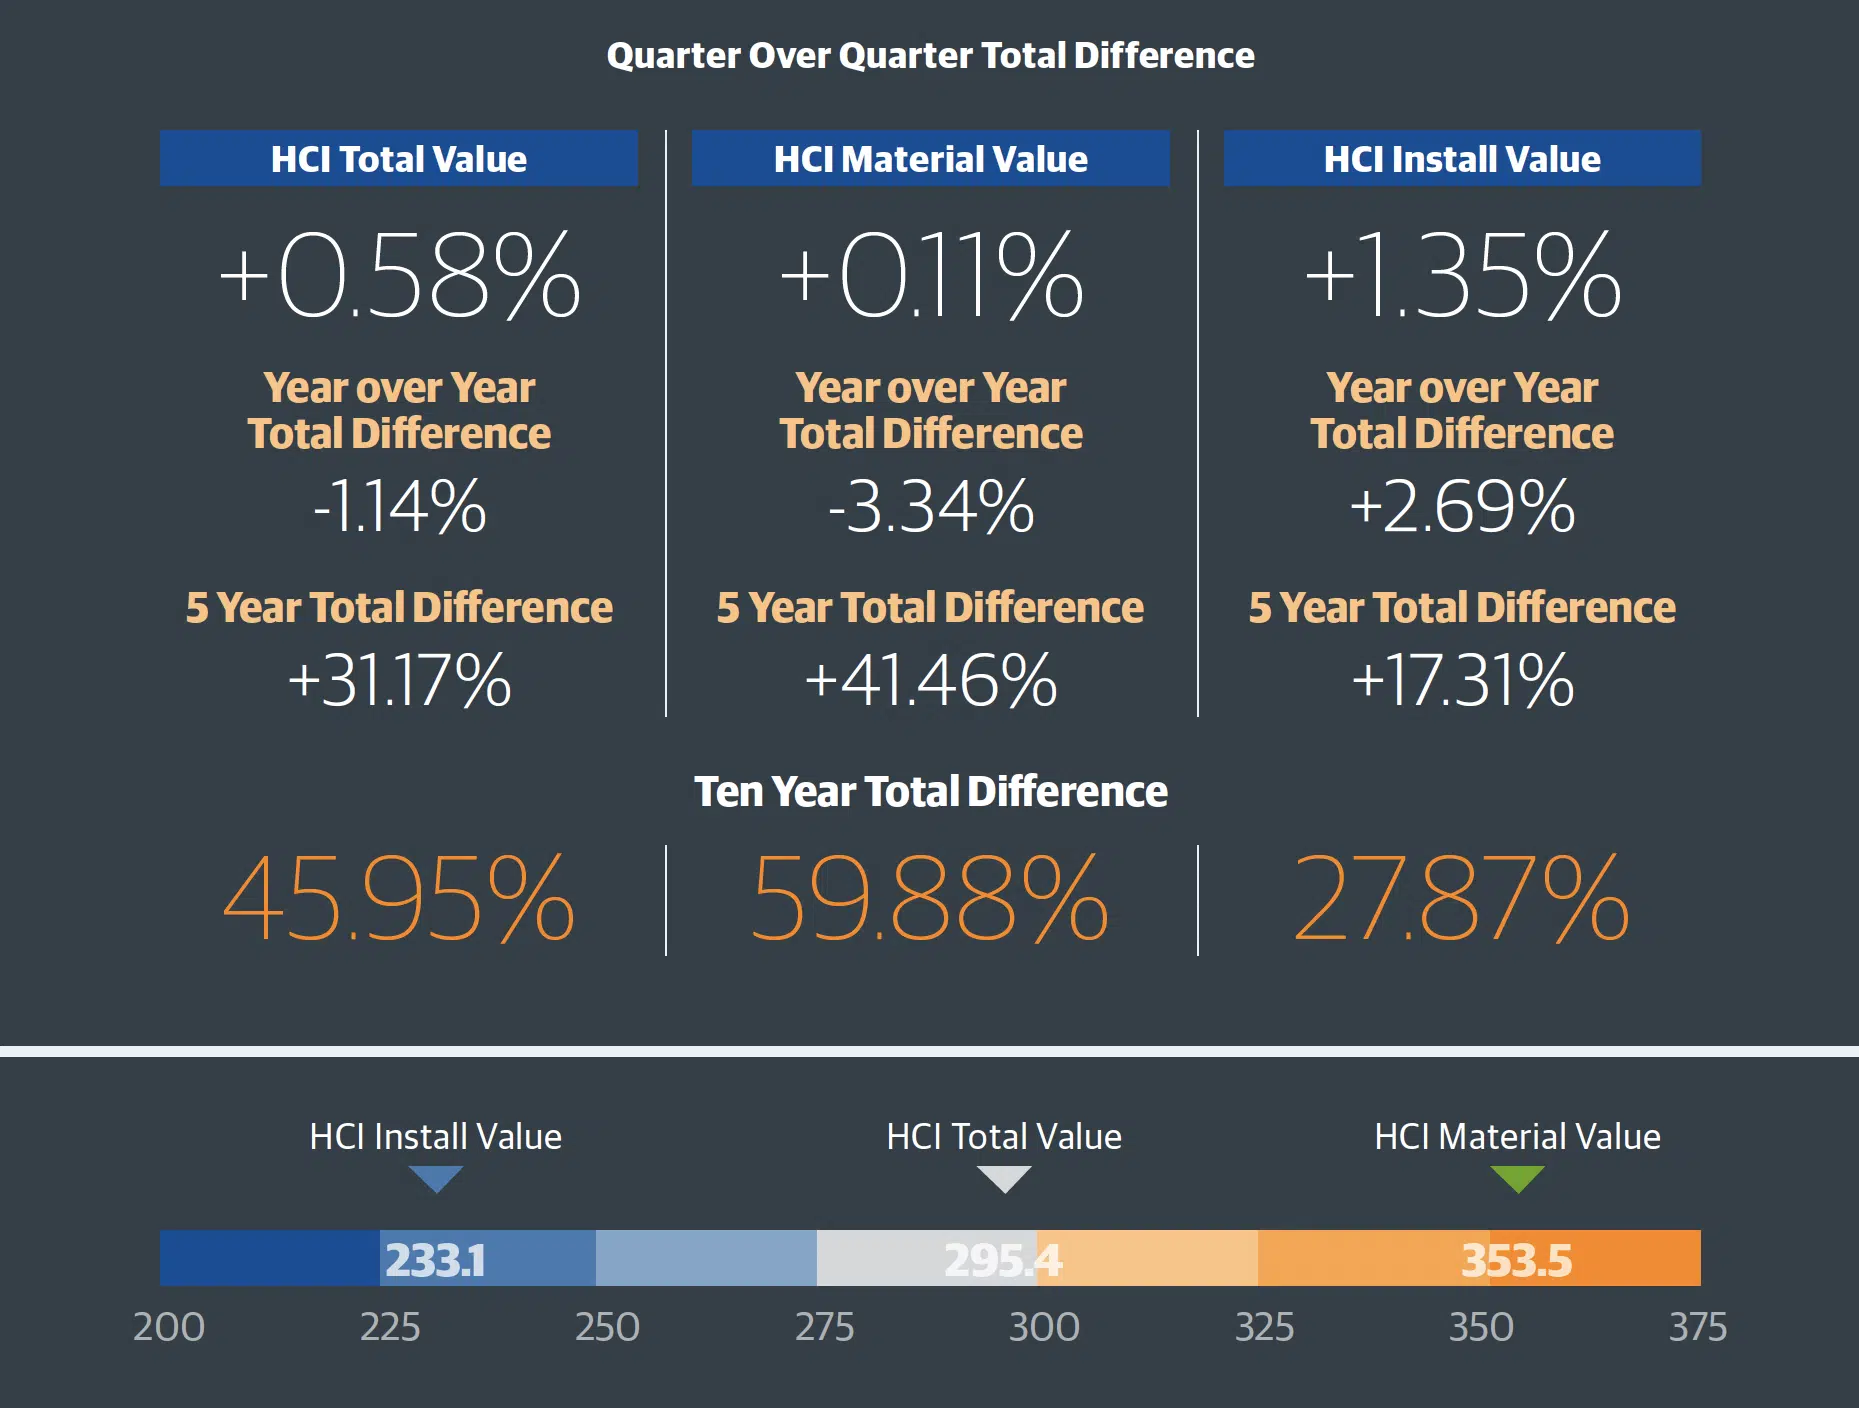
The HCI (Historical Cost Index) is an invaluable tool to track changes in the cost of construction materials and labor over time. The HCI Total Index Value represents the overall change in construction costs, including materials, labor, and installation expenses. The HCI Material Value tracks the change in the cost of raw materials, such as lumber and steel. The HCI Install Value measures the change in the cost of installation labor, including plumbing, electrical, and HVAC. These indices provide valuable insights, helping building industry professionals to anticipate and plan for changes in construction costs and make informed decisions about project budgets and timelines.
NOTES:
- The index values are based on a 30-city national average with a base of 100 on January 1, 1993. The three numbers are the total, material, and install index numbers, respectively, for the 30-city national average in 2023.
- The Historical Cost Index (HCI) applies the quarterly City Cost Index (CCI) updates to a historical benchmark and allows specific locations to be indexed over time. These indexes with RSMeans Data are a vital tool for forecasting construction costs and can be a valuable source of information for comparing, updating, and forecasting construction costs throughout the United States.
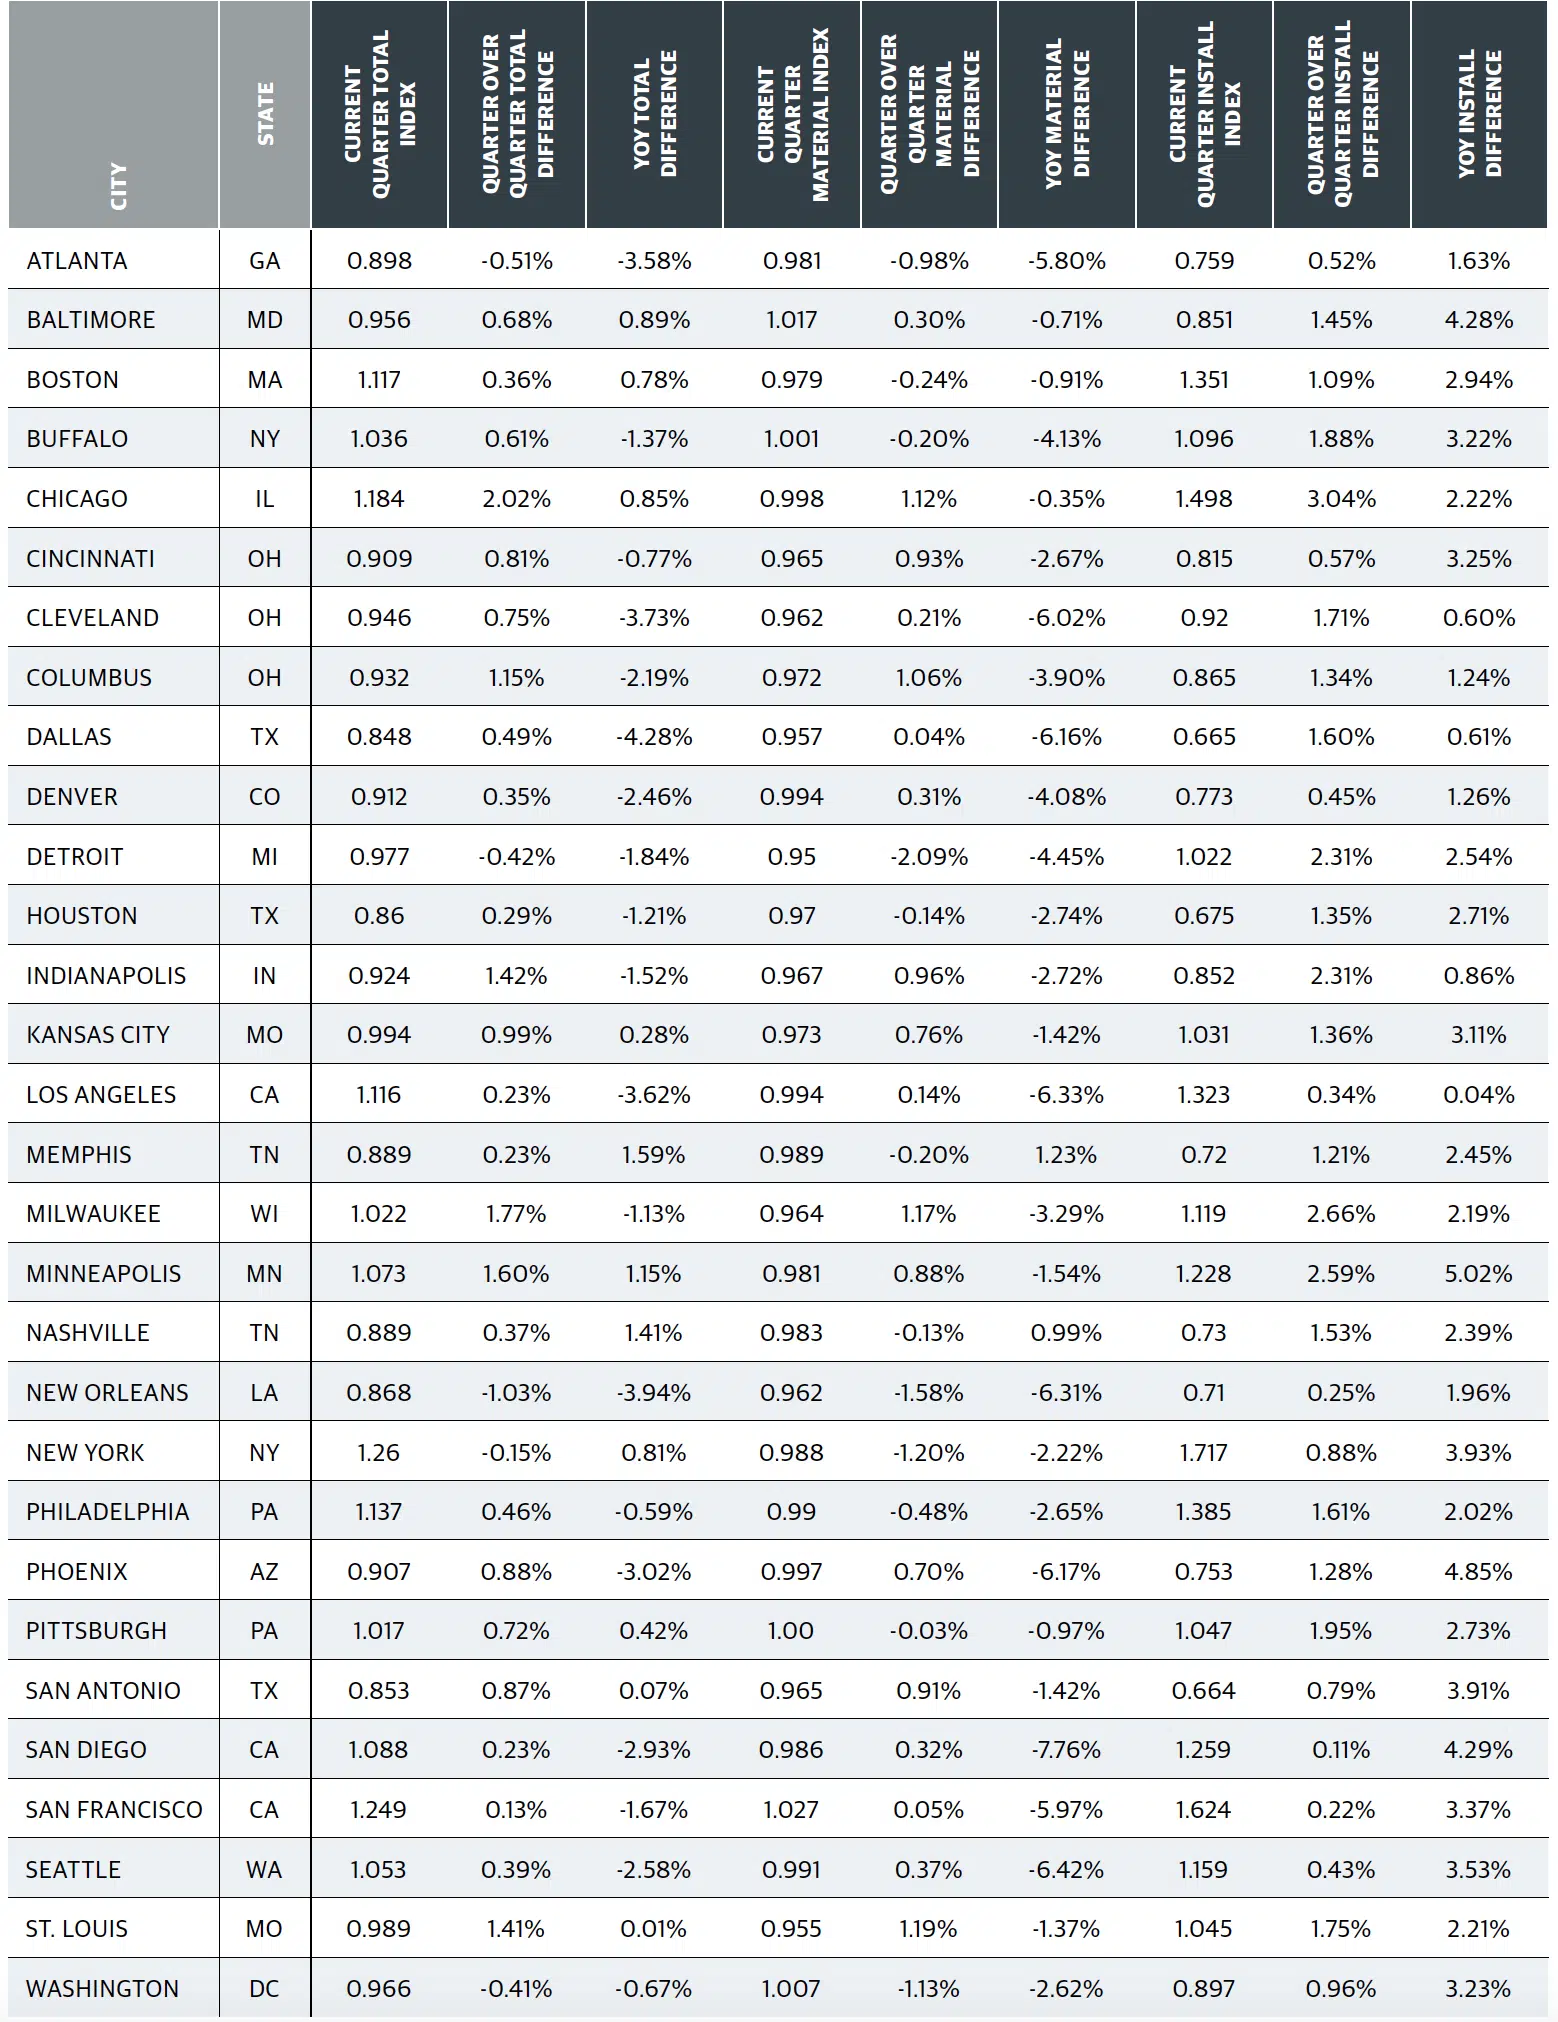
The City Cost Index is a quarterly data product designed to answer the question, “How much higher/lower are costs in my city relative to the national average?” The CCI can be used to better reflect localized pricing in construction estimates. Each quarter, Gordian’s RSMeans Data research team collects prices from cities across the United States and Canada, which are then compared to the national average and the current year’s annual release data to create the CCI. The City Cost Index shows a factor for Material, Installation and Total with rows representing multiple CCI divisions. Additionally, the CCI shows a Material Total, Installation Total and a Total Weighted Average.
State-Level Cost Trends
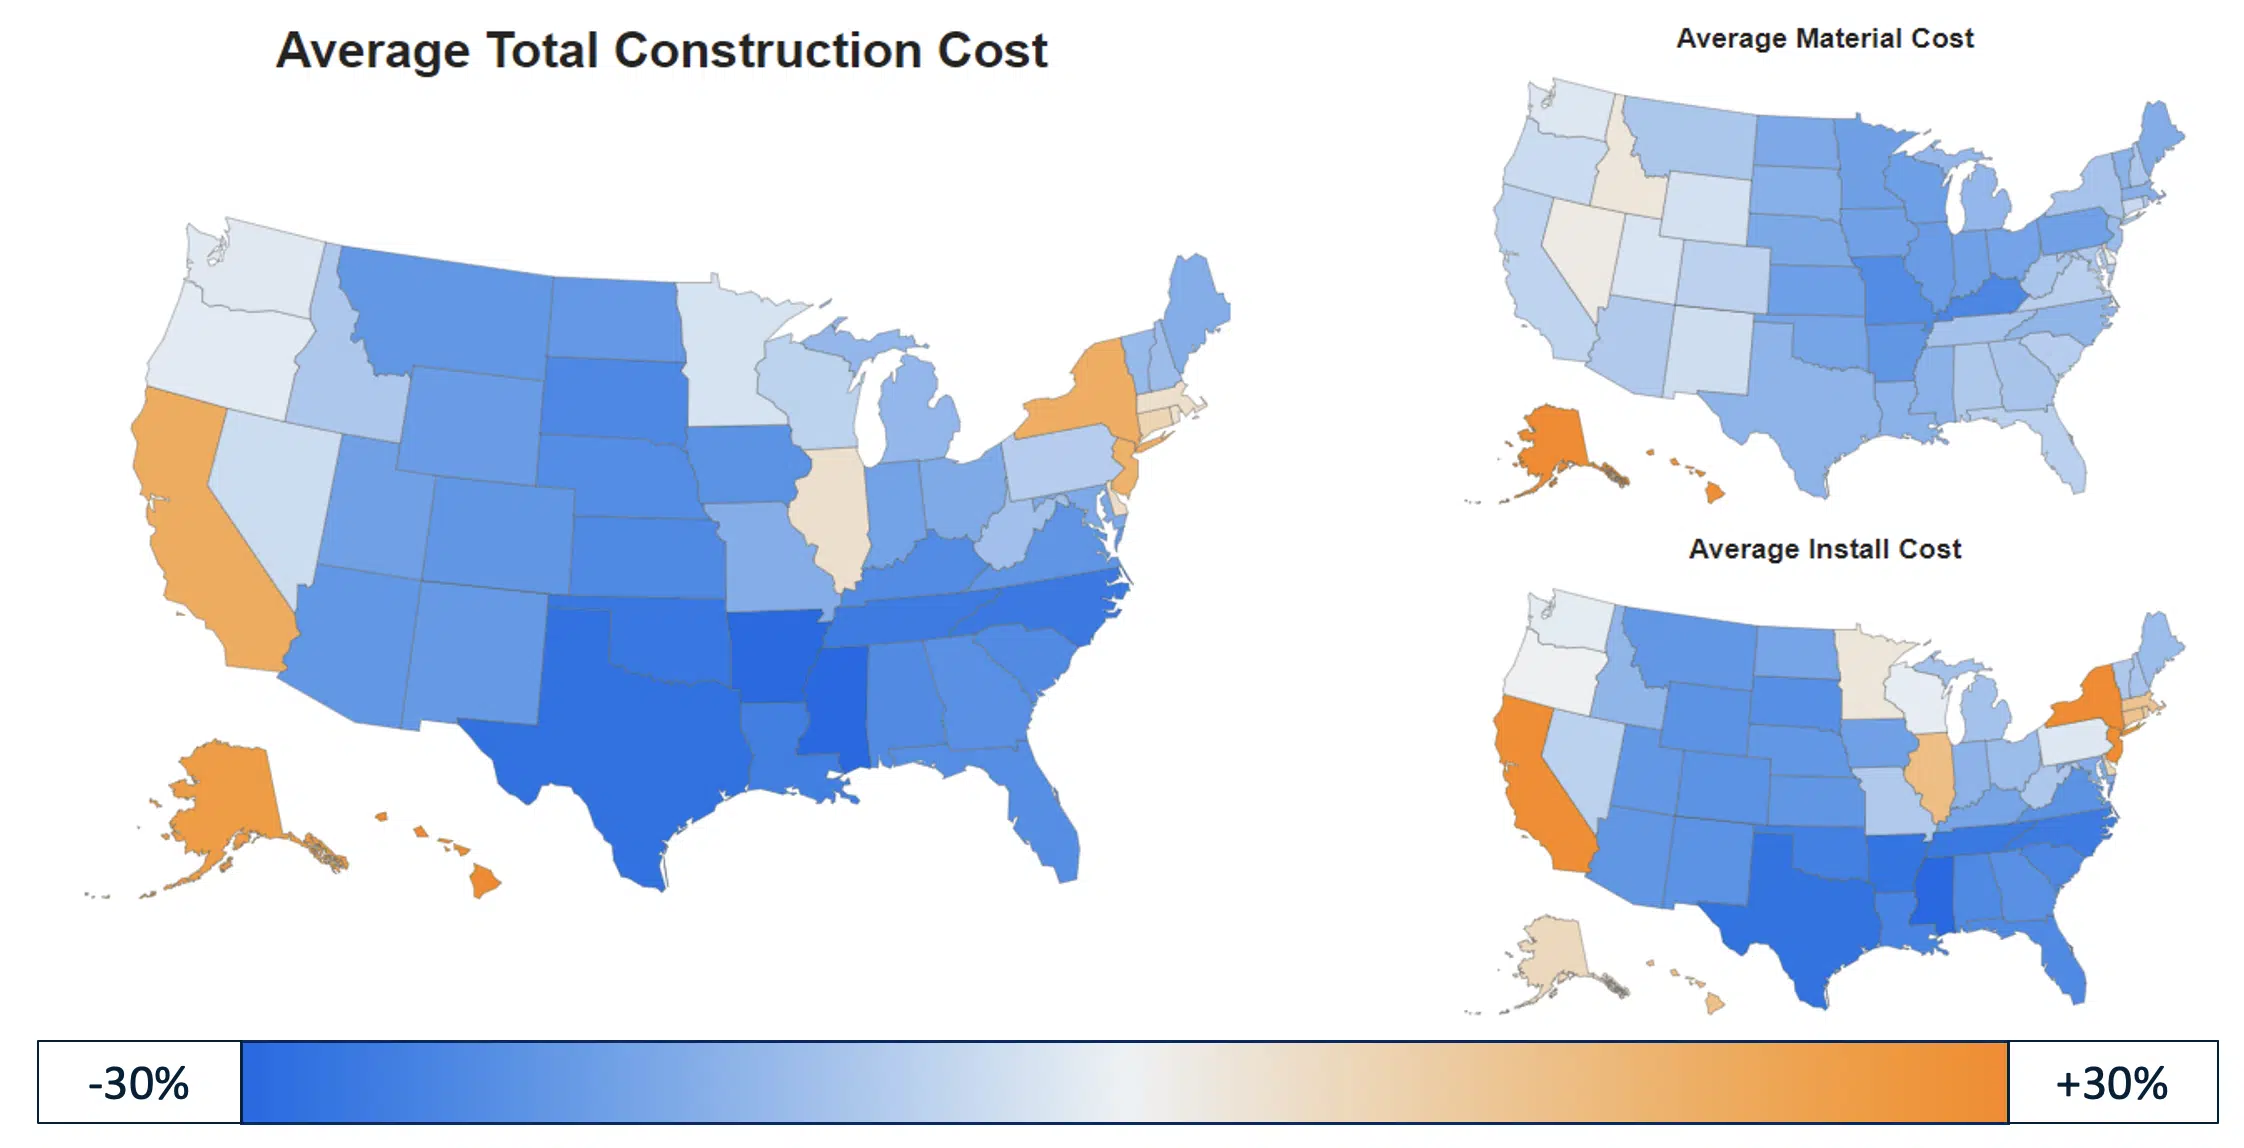
Relative to the national average in 2023 Q4, total construction costs were highest in the same states as usual – Alaska, Hawaii, California and the Northeast. This is most evident when we break out material and install costs.
For material, there’s a clear delineation in cost; the further away from the Mississippi River and the further away from the major manufacturing and industrial centers in the central U.S., the higher the material cost.
For install, the costs are also very similarly delineated. The Southeast and mountain states retain their lower cost of labor, while the Midwest, West Coast, Northeast and OCONUS locations continue to hold higher costs.
What the data says:
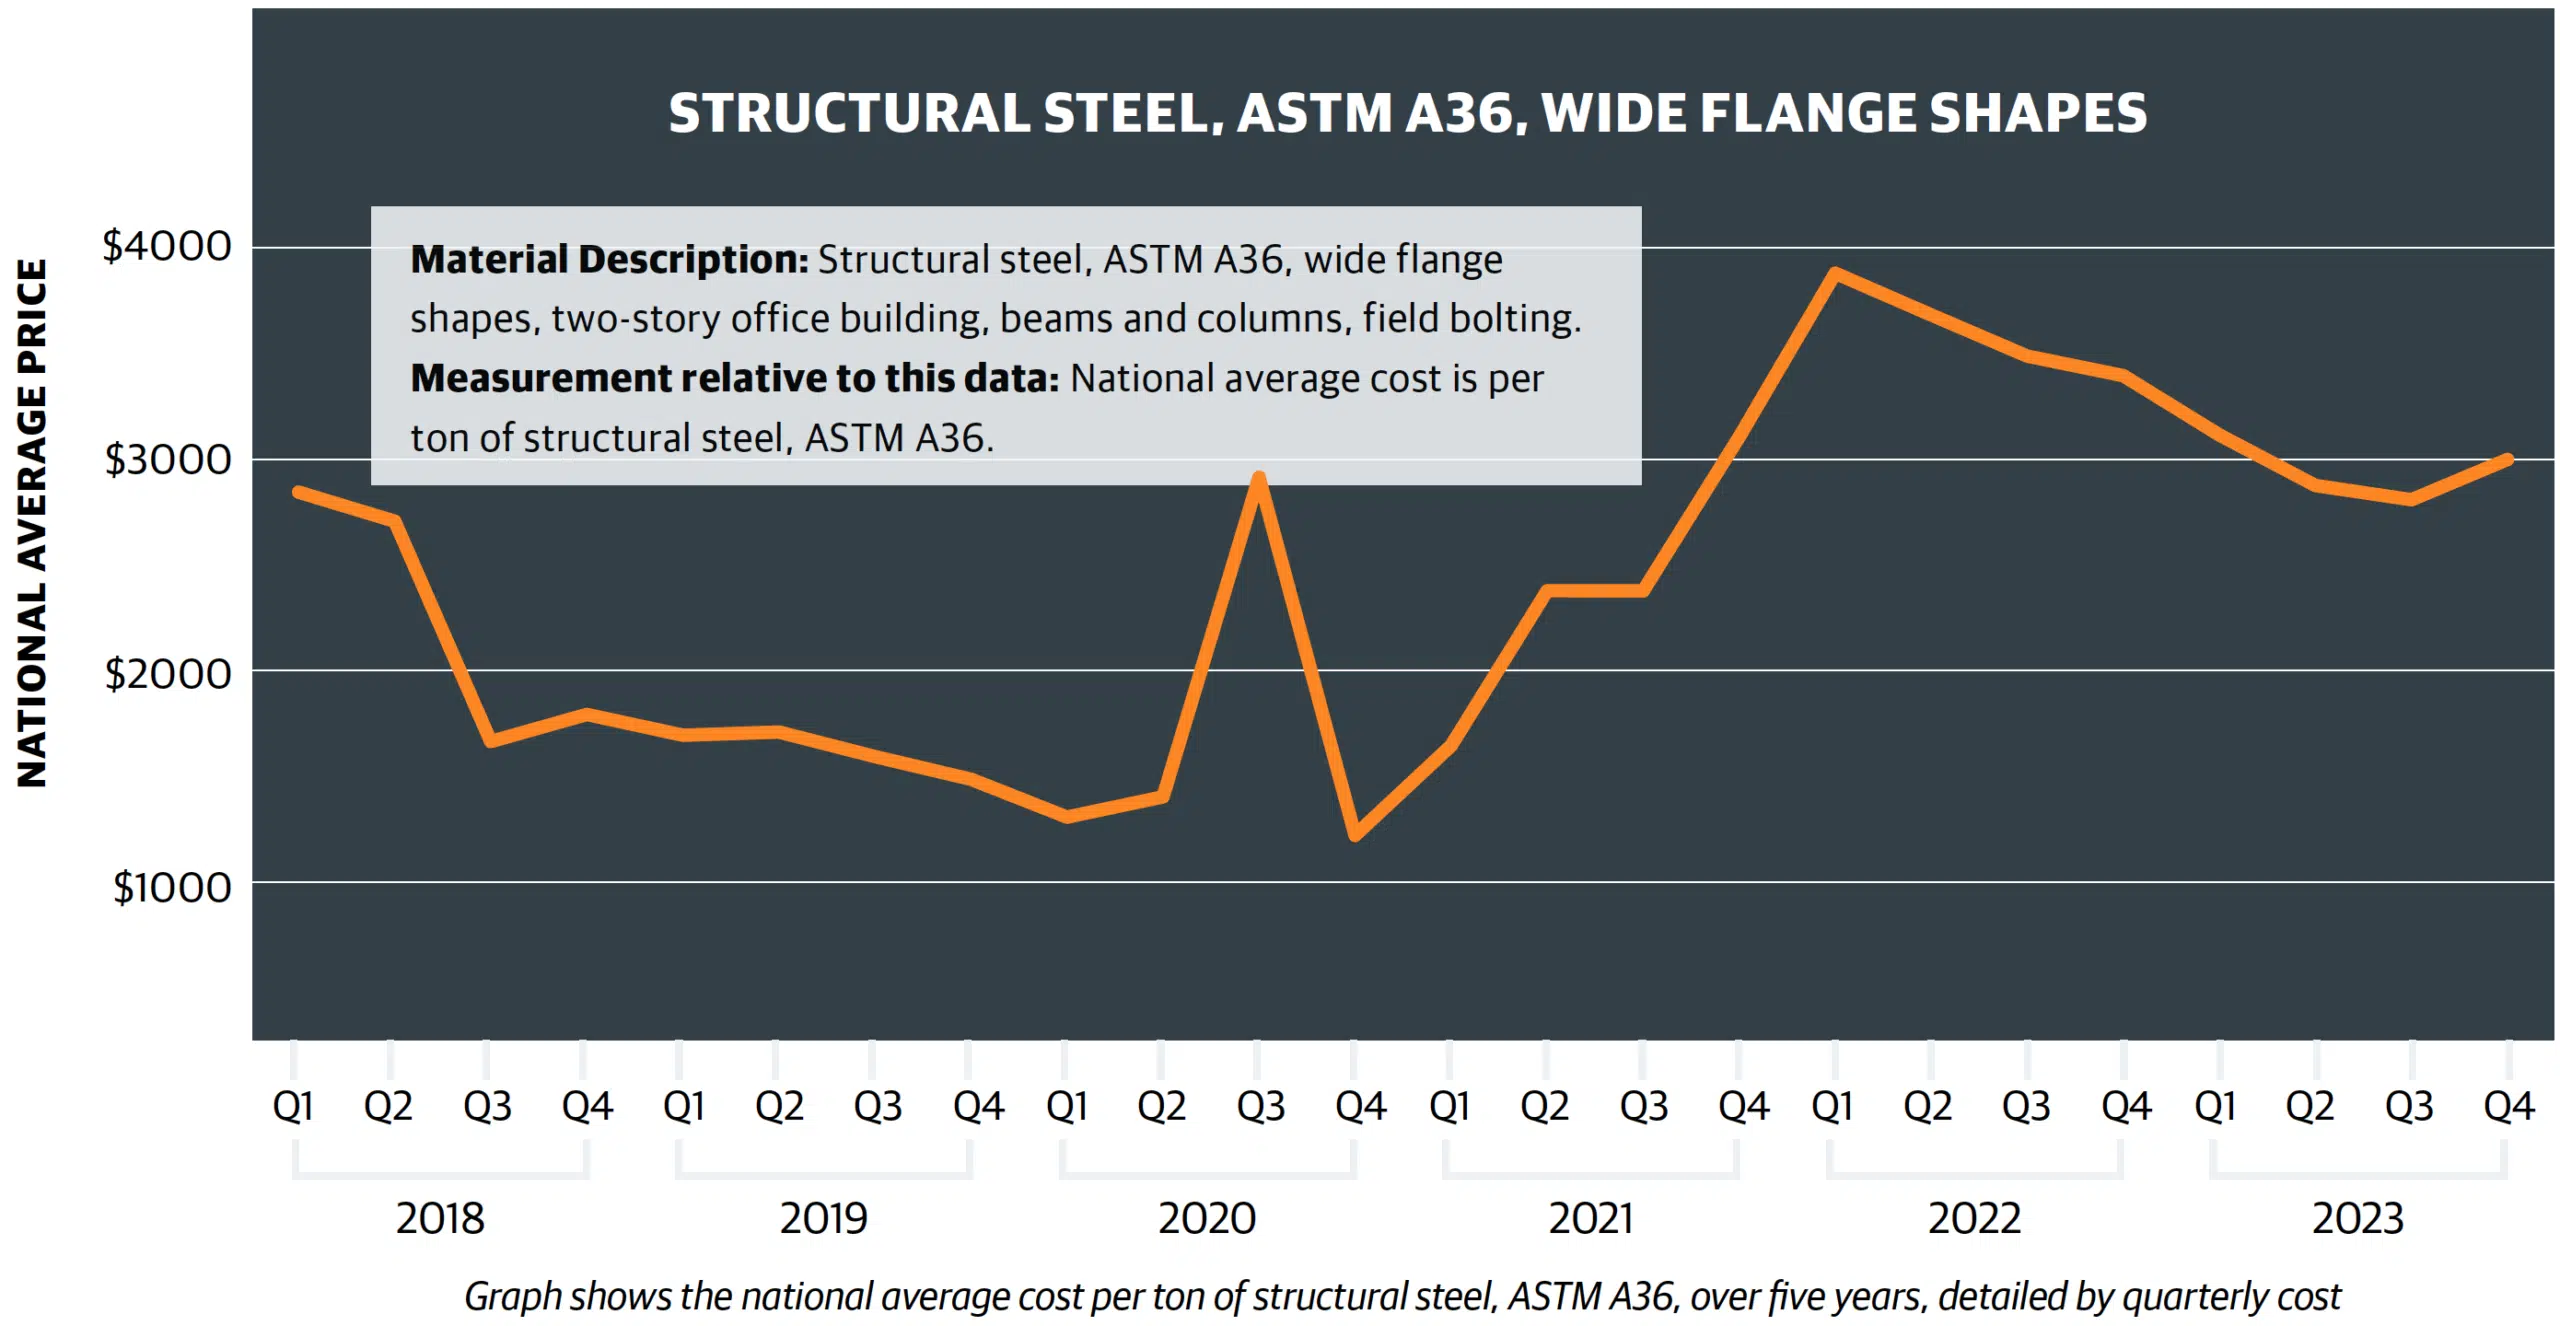
- Steady increases from 2021 continued through 2022
- Cost acceleration in late 2022 Q1/Q2 due to supply chain constraints
- Cost stabilizations/ decrease continued into 2023 Q1/Q2/Q3
- 2023 Q4 sees a 6.85% quarter-over-quarter increase, but still below the highs of 2022
View from the field:
- PCL: “Rebar and HRC steel have been hitting multi-year lows due to muted global and domestic demand amid a global supply surplus. Demand has been picking up and just in early October, it appears that the HRC steel price hit a ‘floor’ and has started to rebound.”
- SKANSKA: “As a result of some geographical markets experiencing a softening in demand for large steel structures, pricing and lead times have stabilized. Higher interest rates, weakness in the commercial office space markets and fewer product distribution projects moving forward are causing these privately funded projects to be postponed. However, there are still enough projects going forward to keep steel fabrication capacity booked out through Q2 of 2024.”
- WEBCOR: “The price volatility of structural steel has stabilized from the chaos of a couple years ago. The issues then were the tariffs imposed by the Trump administration (which remain in place under the Biden
administration) and the diversion of recycled steel to China, depressing the amount of material available for steel fabrication. The fact that there are fewer tall, steel-framed structures being built is one key reason prices have fallen and supplies are available.”
What the data says:
- High price increases through most of 2022 driven by supply constraints
- 2023 Q2 rose but at a lower rate than Q1; Q3 and Q4 each saw a slight decline
View from the field:
- GORDIAN: “Pricing for concrete blocks decreased slightly over the previous year, but there was a 20% increase in prices in some areas during the summer, due to some stores having complications with their suppliers.”
- PCL: “Concrete mix and repair compound have experienced multiple cost increases over the past 24 months due to raw material, labor, and freight increases. Prices at historically high levels have recently begun to level out.”
- SKANSKA: “Cement and concrete are largely driven by local supply chain constraints; however, this market has largely stabilized over the past two years. At a national level, there is a long-term trend to reduce embodied carbon of which cement and concrete usage is one of the largest contributors. This may increase the cost of concrete as it is more expensive to produce cement with sustainable energy sources and new concrete mixes that are being developed utilizing higher-cost formulations.”
What the data says:
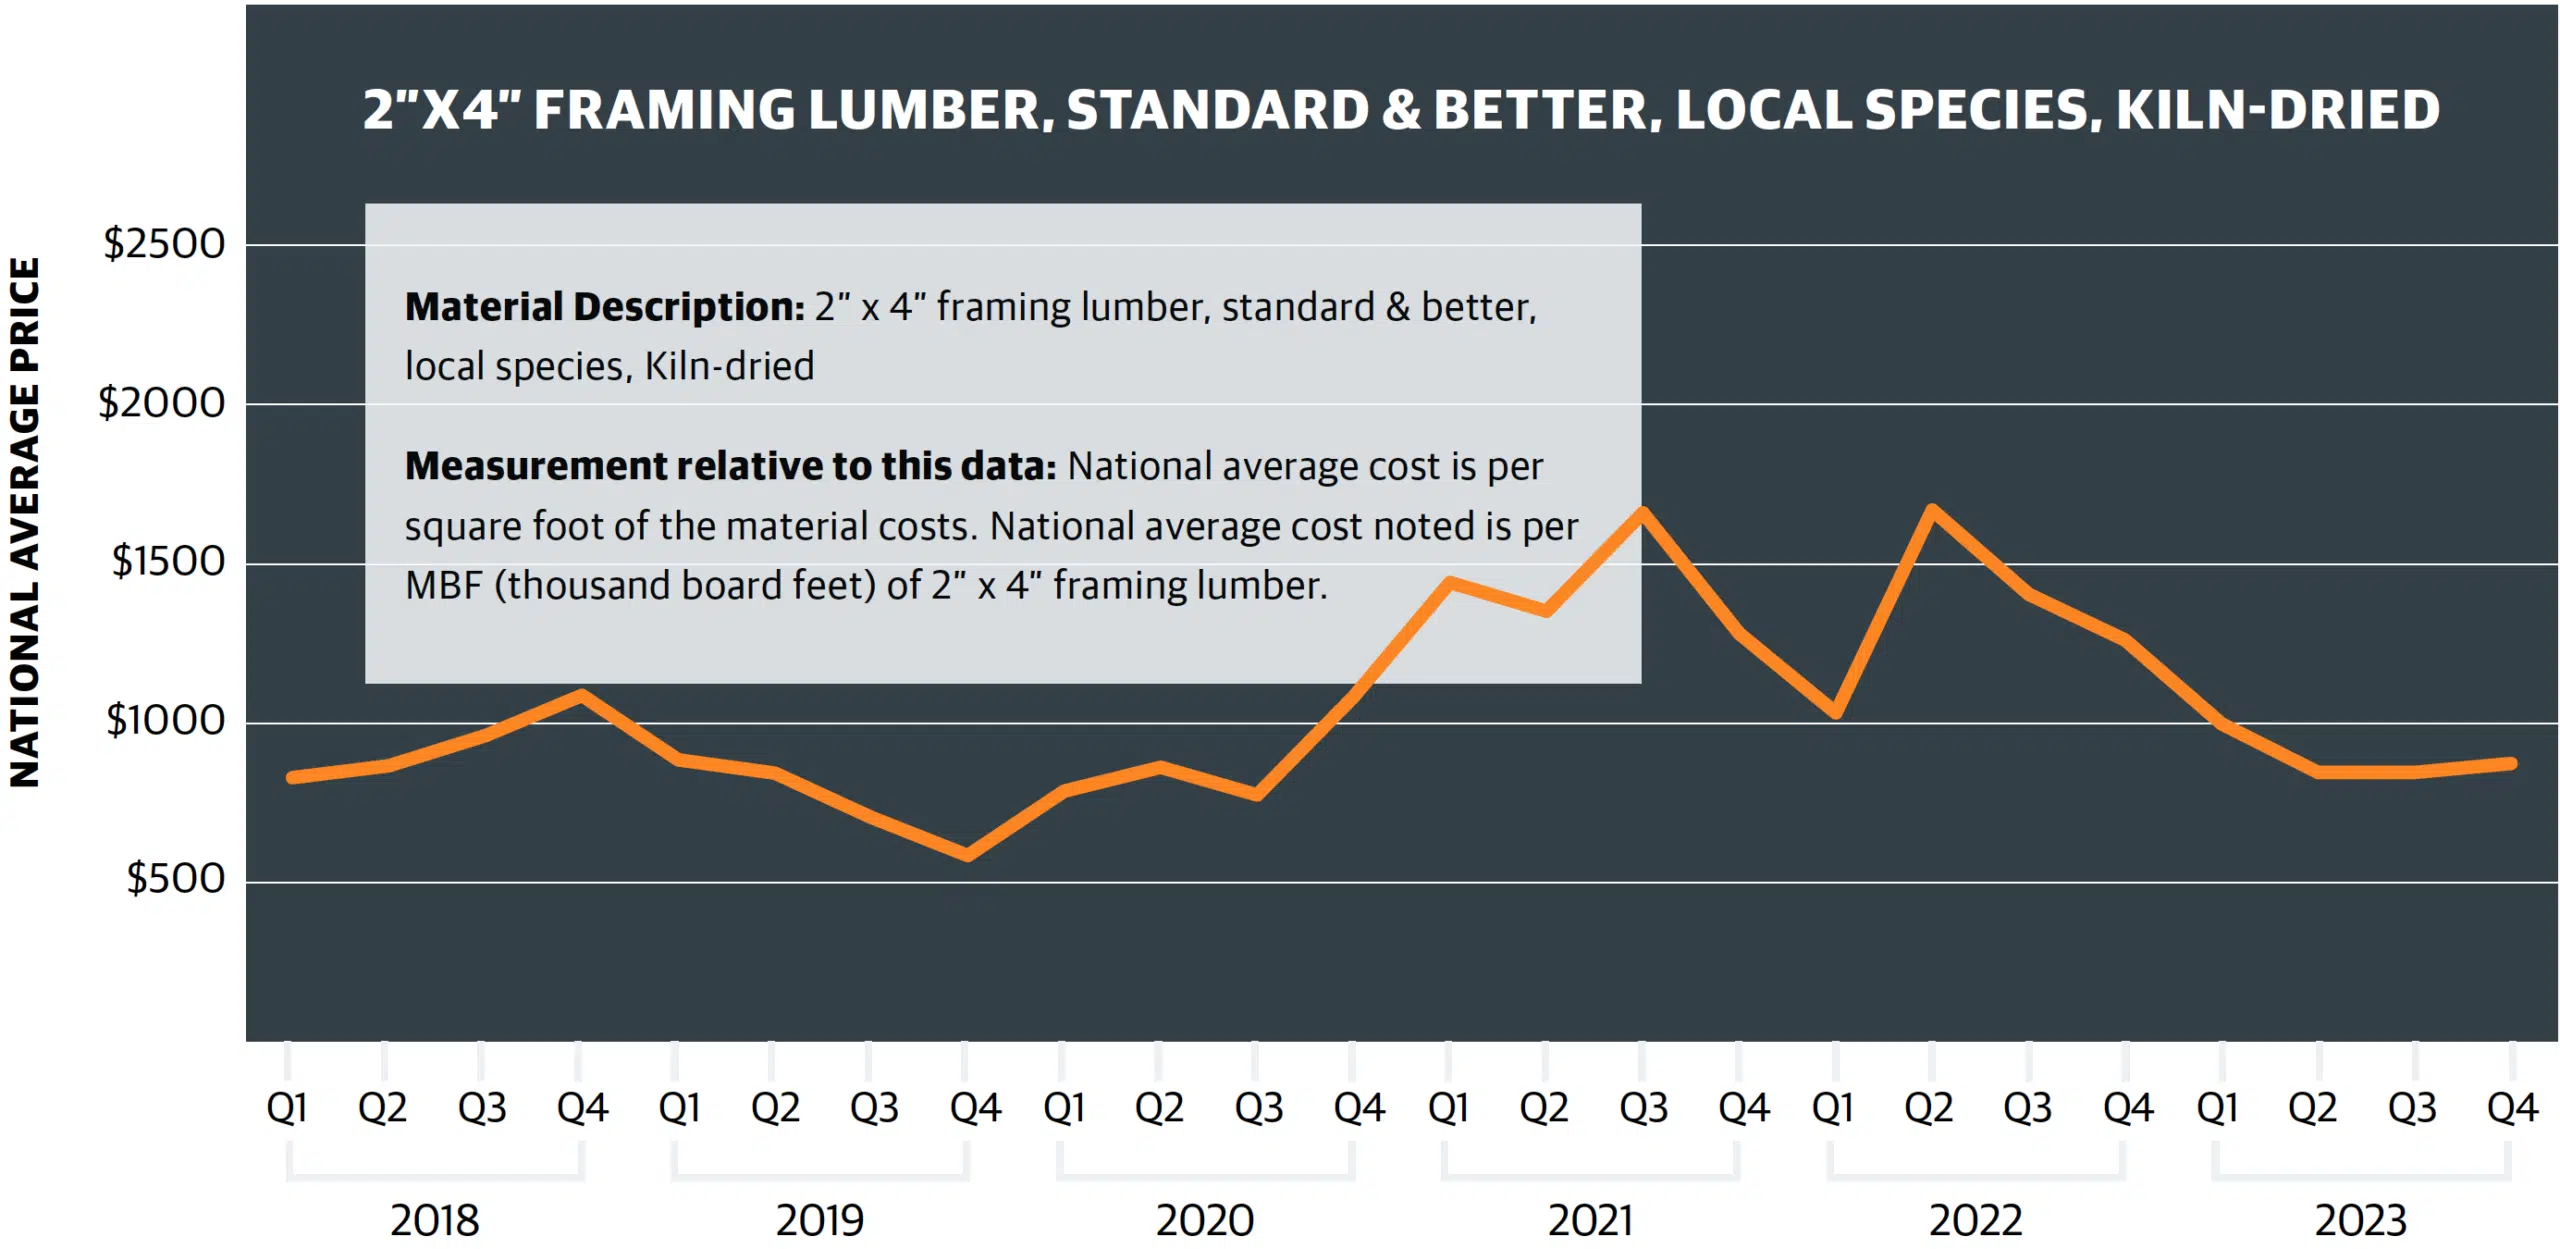
- 2023 lumber prices declined after climbs since 2020
- Typical season peak observed in 2022 Q2
- Pricing stabilization/ decrease seen in 2023 Q2/Q3
- Slight increase in 2023 Q4
View from the field:
- PCL: “Lumber prices have been at historically low levels since a spike during COVID and have been very slow to rebound.”
- SKANSKA: “Lumber prices have fallen significantly over the past two years as residential construction starts have continued to fall. We expect the pricing to stabilize and remain flat at pre-COVID-19 levels until the residential market starts to recover.”
- WEBCOR: “Prices are back down to pre-COVID levels, due mainly to lower demand.”
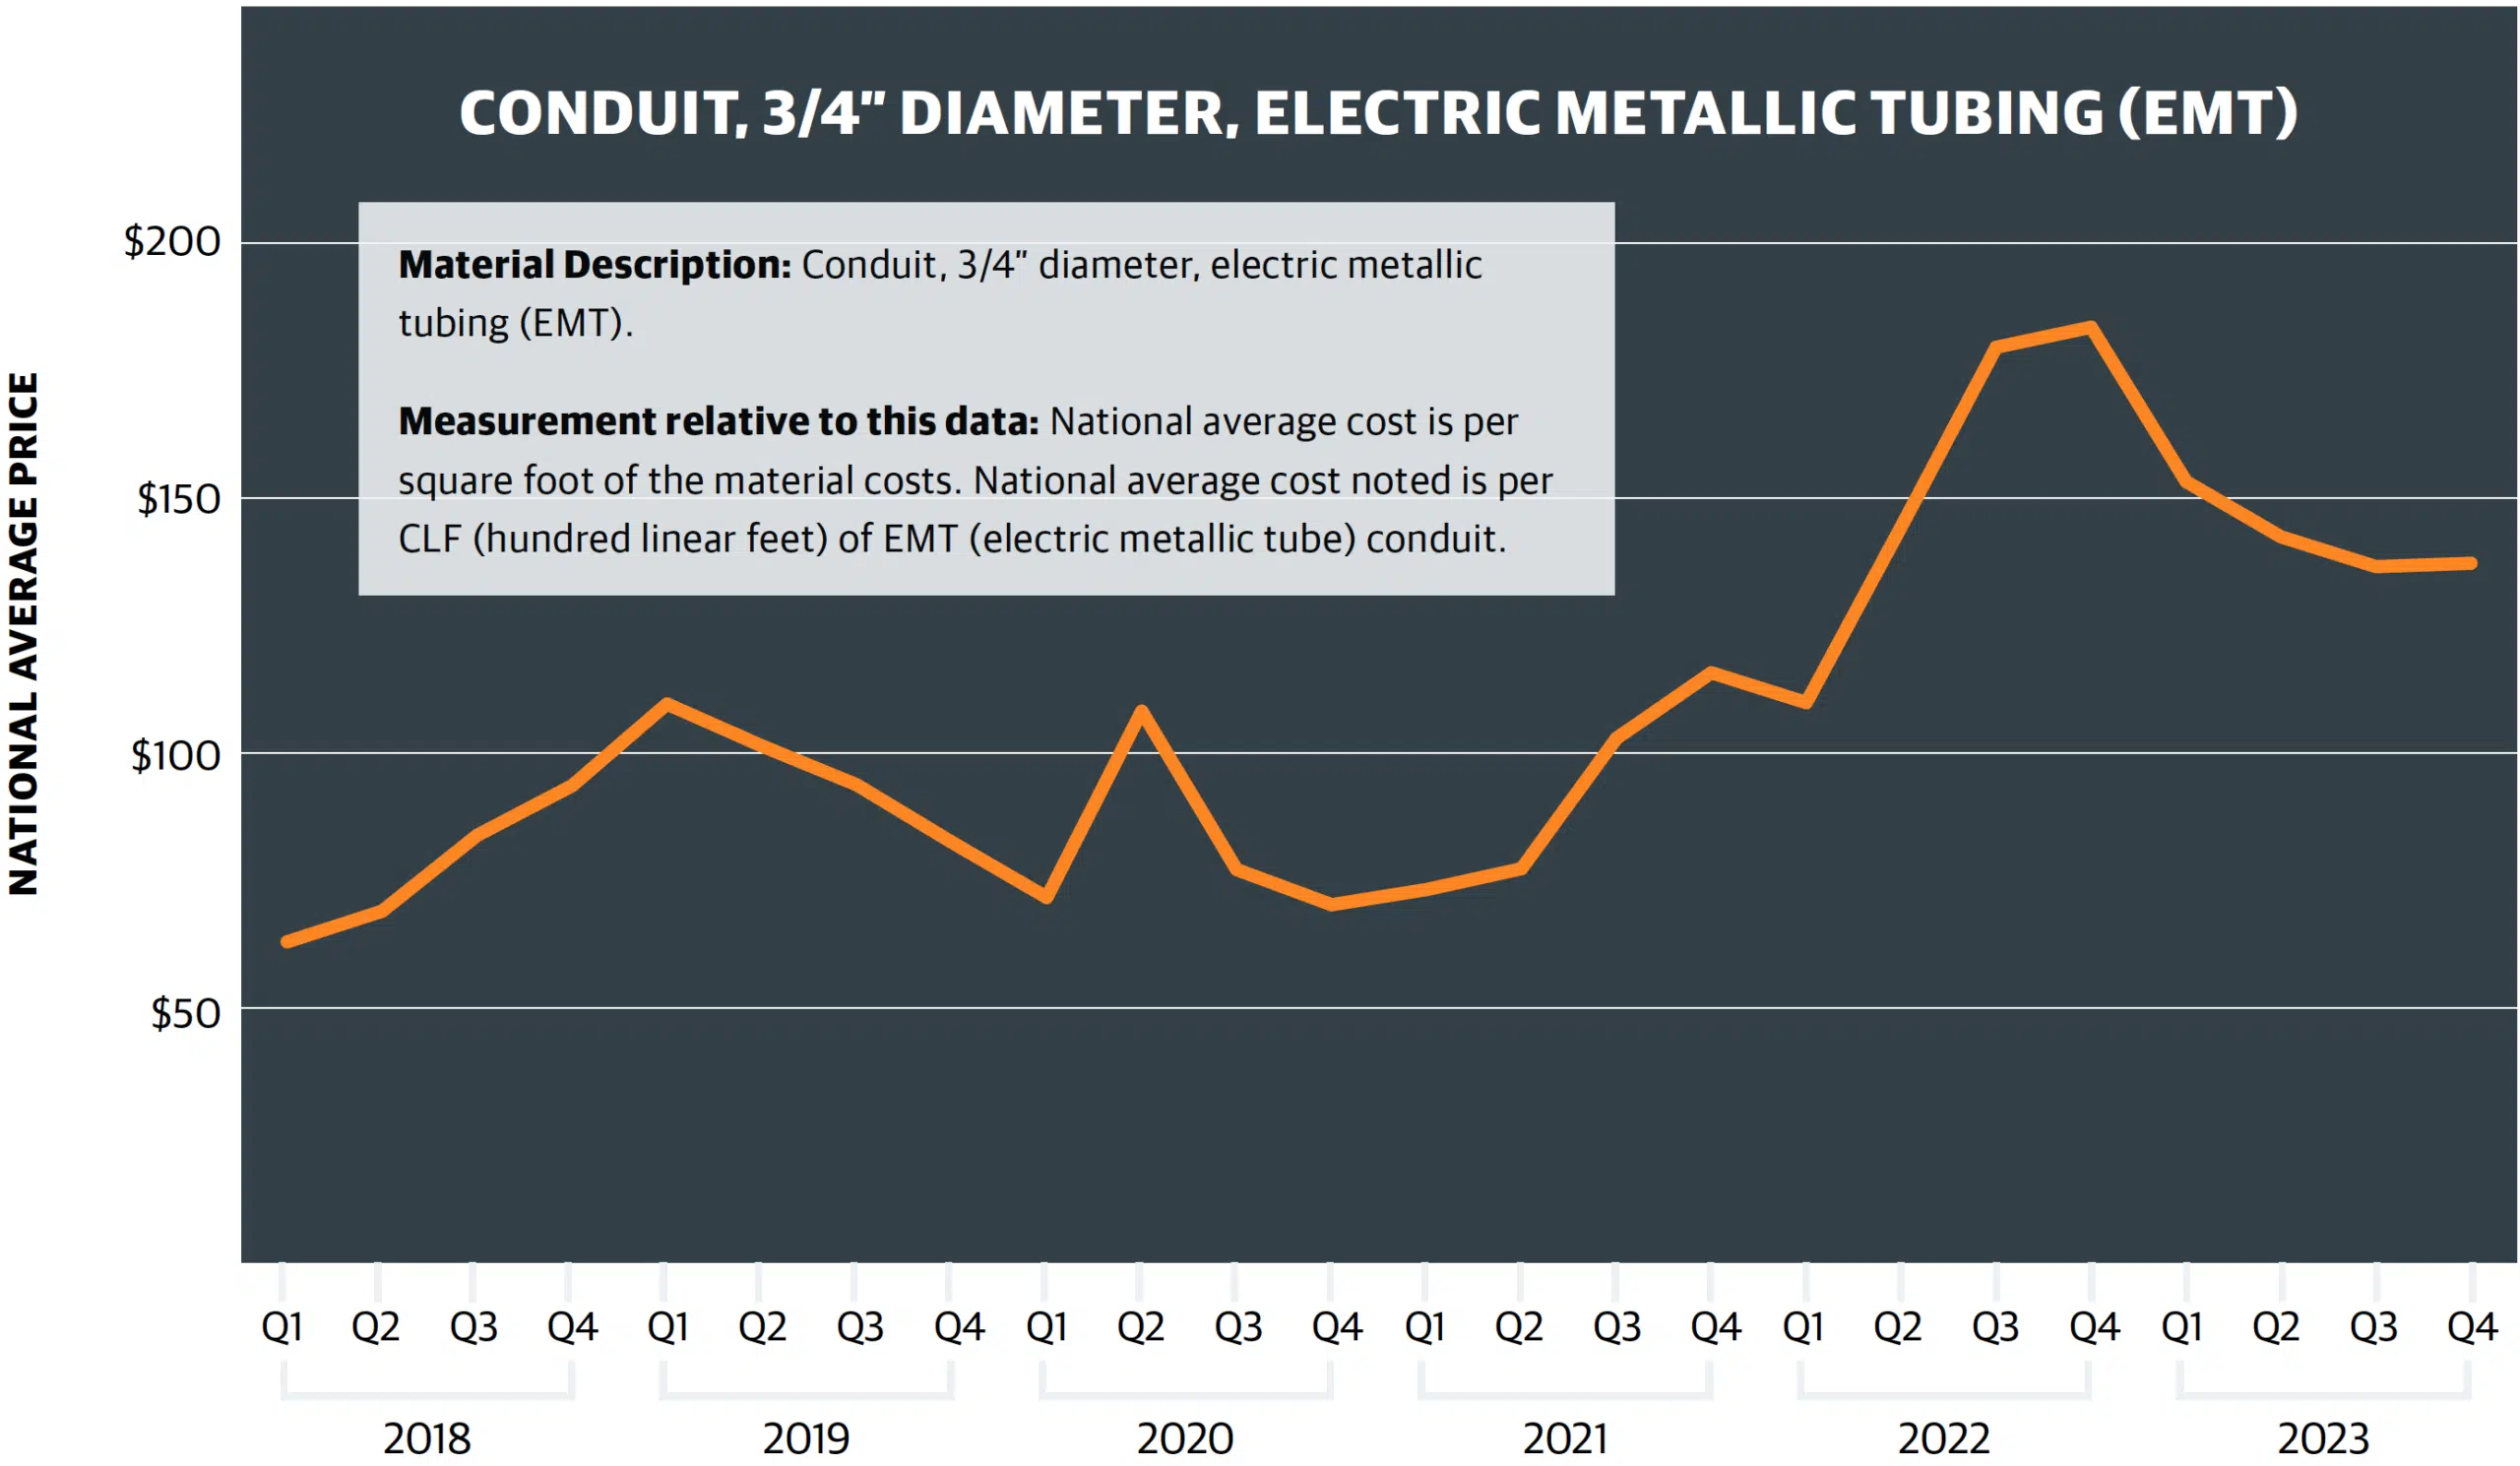
What the data says:
- Significant escalations in 2022 Q2 – Q4 driven by international supply chain
- 2023 prices slowly coming down from 2022 highs, although Q4 did see a very slight increase (just over .5%)
View from the field:
- SKANSKA: “Conduit [and copper wire] are generally considered commodity items and are driven in large part by raw material prices, conversion costs (labor) and market demand. As with electrical gear, we are in a period of unprecedented demand, so there may be isolated shortages of material. For example, domestically fabricated medium voltage cable is currently in short supply and will likely remain that way for many months or even longer.”
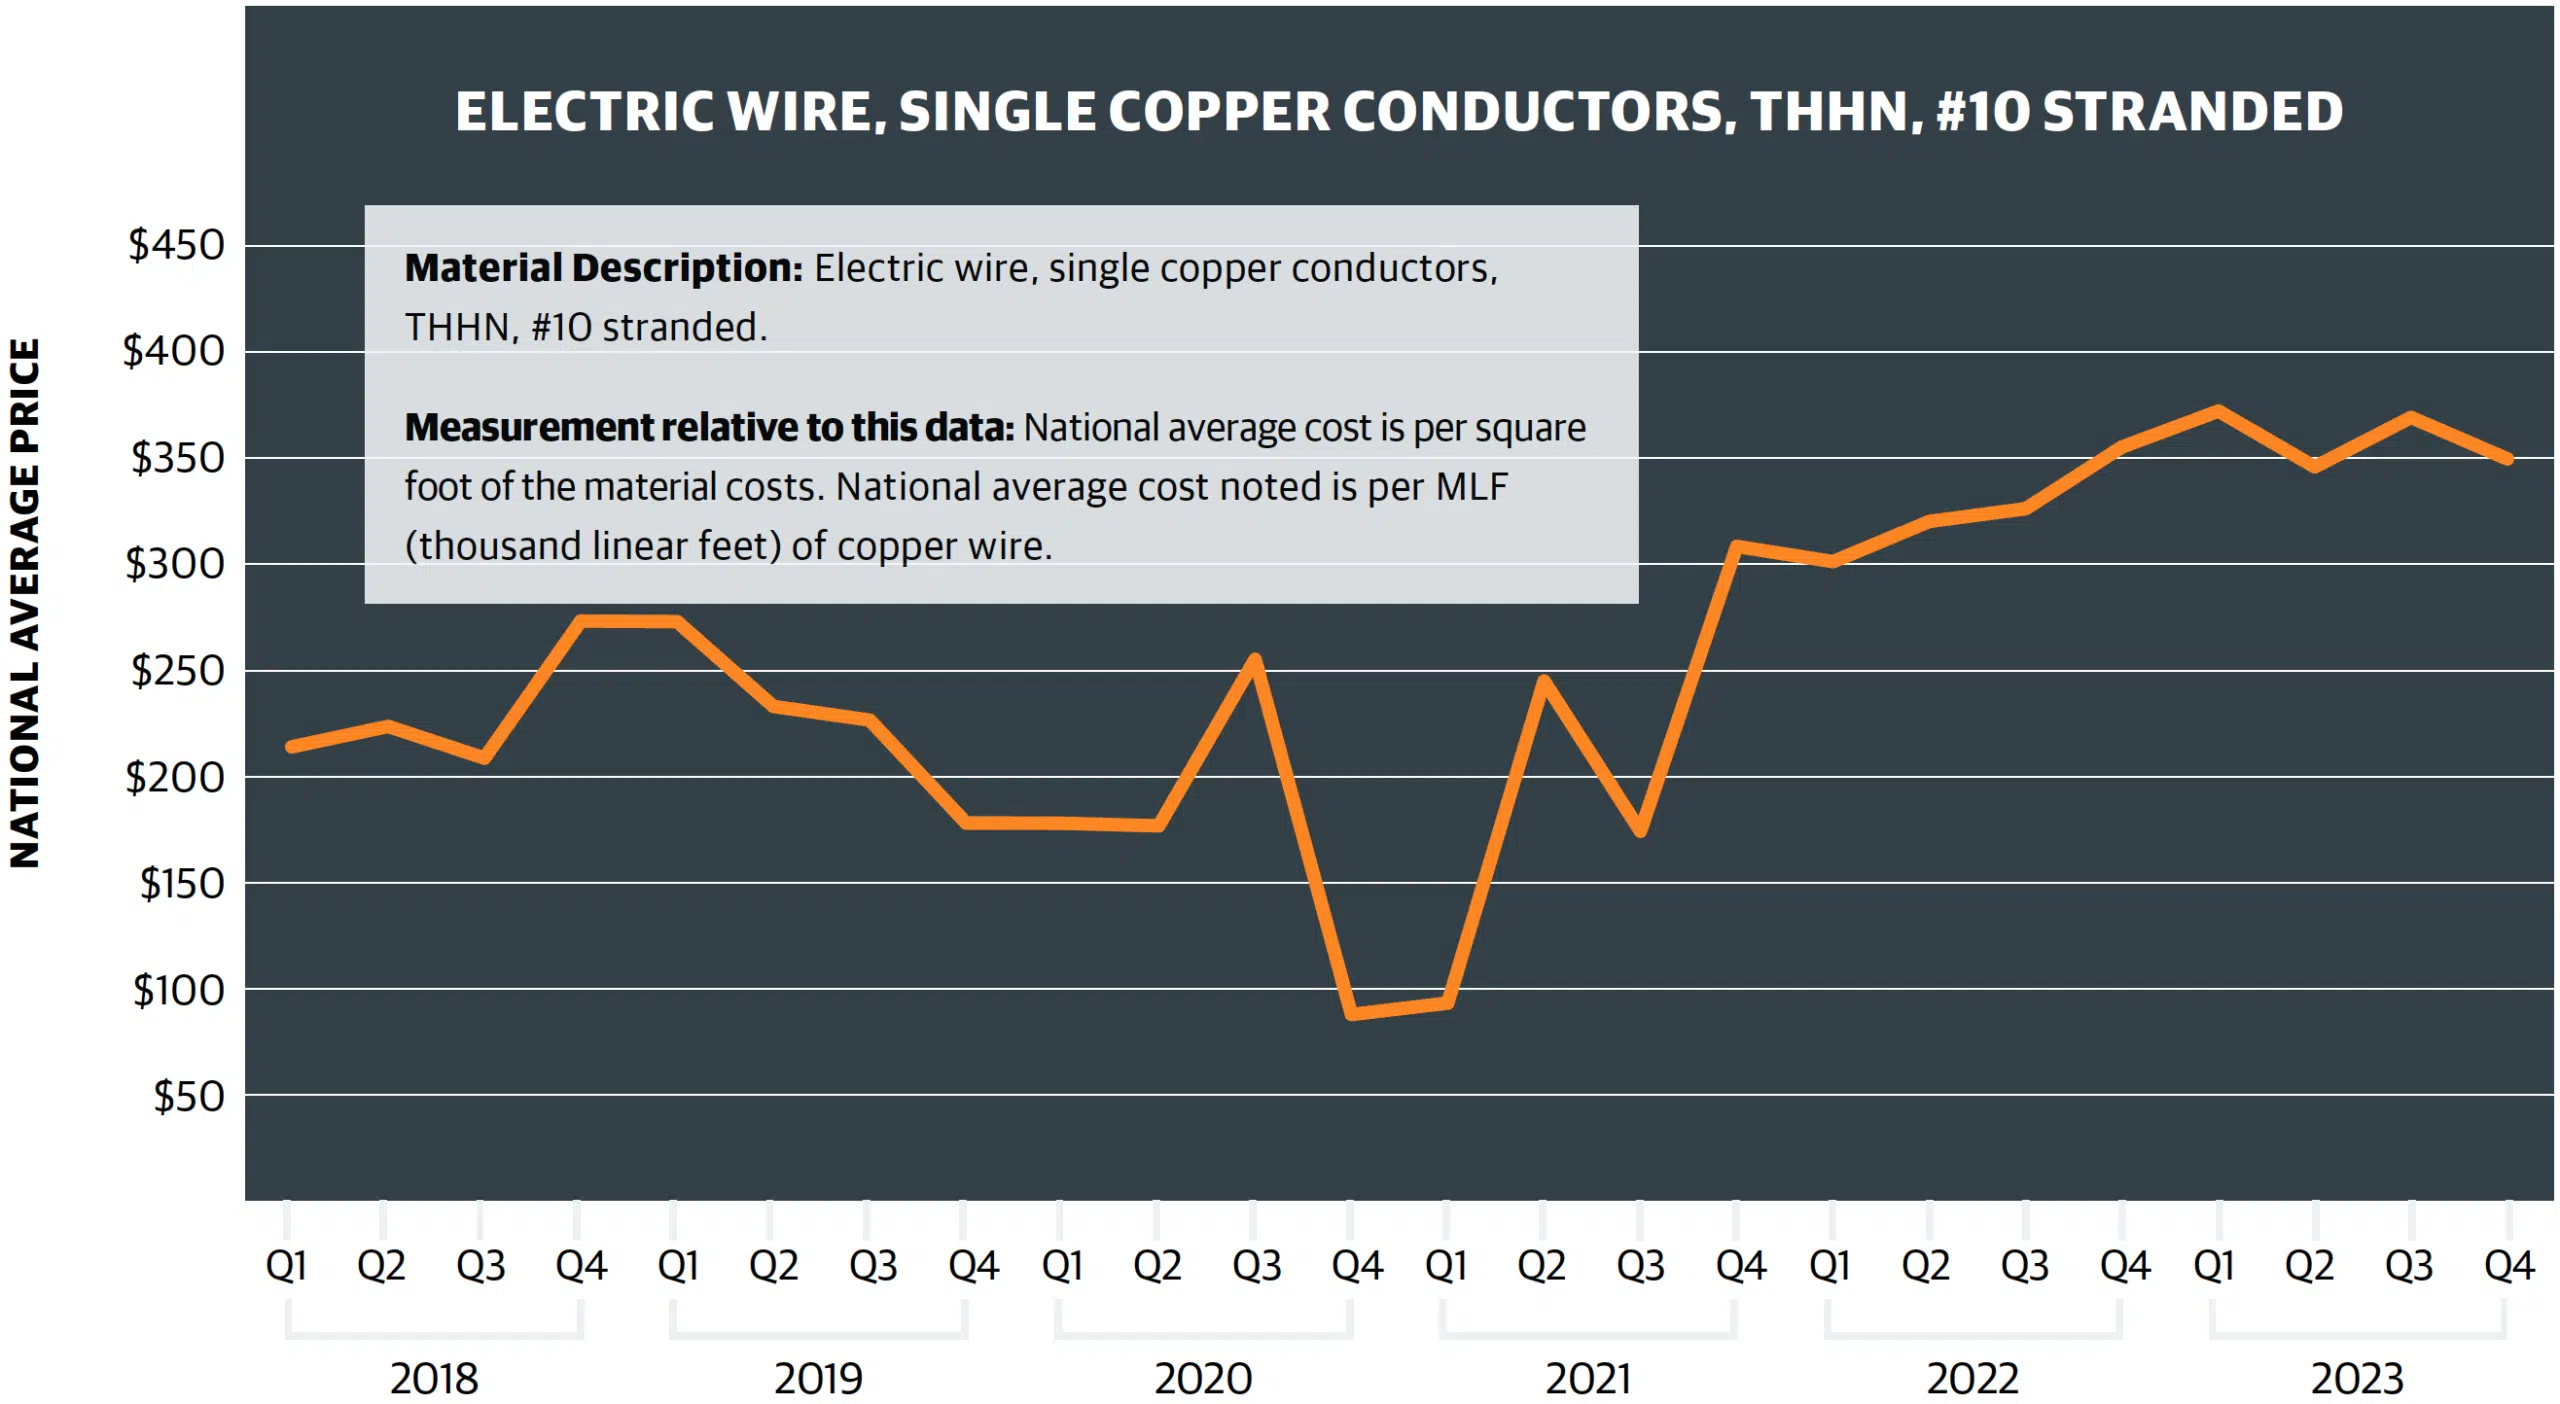
What the data says:
- Significant escalations in 2022 Q2 – Q4 driven by international supply chain
- Copper price increases continuing into 2023, although closing out Q4 with a minor decrease from Q3
View from the field:
- PCL: “Copper, as a raw material, experienced a sharp rise in price during and just after COVID; however, dulled economic conditions and lower than expected global demand have left copper prices somewhat depressed. Eventually demand and the price of copper are expected to normalize and rebound.”
- WEBCOR: “A copper wire manufacturing facility that supplies much of the industry’s needs caught fire, creating a domino effect in the electrical industry. It is taking months to procure. The increase in hurricane activity in southern states, where a number of resin factories that produce wire coatings are located, is another reason for the price and availability of copper wire. When a hurricane takes out one or two of those facilities, prices spike in the downstream supply chain. These spikes tend to be short-term, driven by volatile, unpredictable weather associated with climate change. The price of copper is also a factor.”
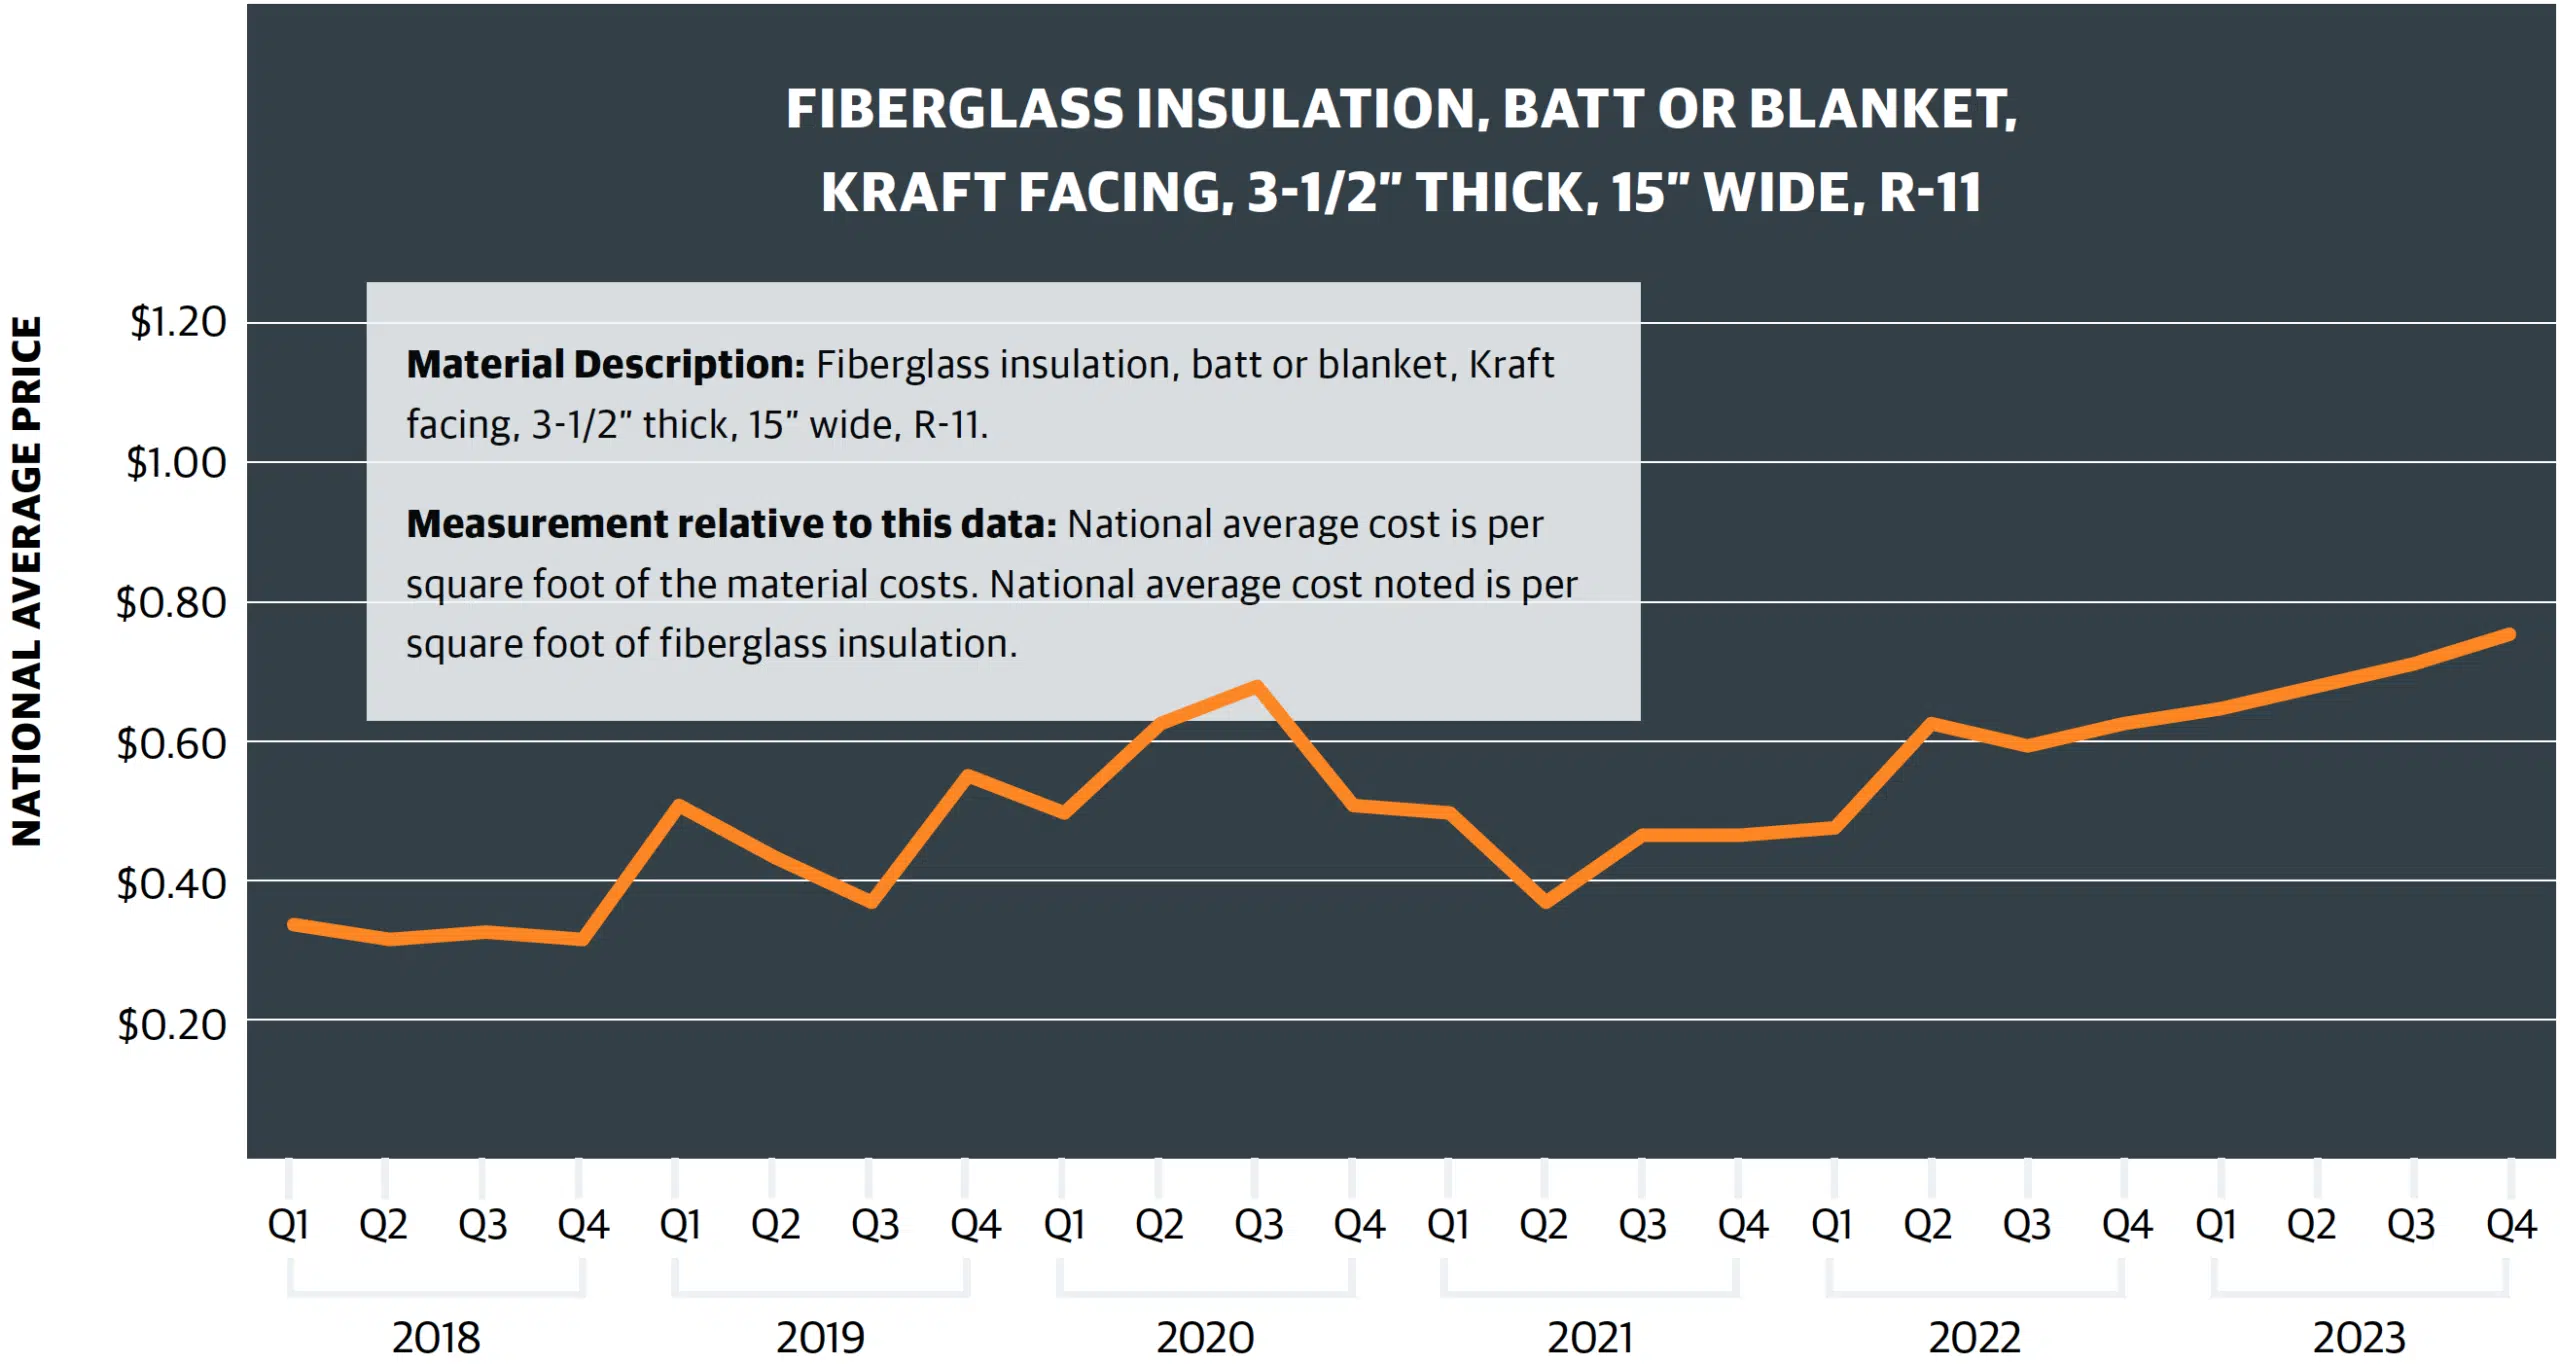
What the data says:
- Supply shortages drove up prices in 2022 Q1 after two years of decline
- Prices holding at these higher levels in 2023, creeping up each quarter
View from the field:
- GORDIAN: “Prices for fiberglass insulation have risen continuously in the previous year, going up over 20% year-over-year. This is likely to continue, in part due to credits families can claim for adding and installing new insulation in their homes from the Inflation Reduction Act.”
- PCL: “Multiple cost increases over the past 24 months due to raw material, labor, and freight increases. Prices at high levels but have recently showed signs of normalizing.”
- SKANSKA: “Most insulation including fiberglass and rigid foam lead times have improved. This is not the case for mineral wool insulation. Two of the major manufacturers are reporting lead times as long as five months.”
- Material costs remain high relative to prior years, although there has been stabilization. Some categories are showing signs of regression to pre-pandemic levels
- Labor costs are under a close watch, especially with major funded projects beginning
- Project prioritization and timing need to be scrutinized to ensure successful outcomes
The Following Supply Chain Subject Matter Experts Contributed Their Views For This Q4 Analysis:
PCL CONSTRUCTION
- Michael Streit, Contracts and Customs Coordinator
- Eric Orquiola, Director, Preconstruction and Estimating
SKANSKA USA BUILDING
- Tom Park, Vice President, National Strategic Supply Chain
GORDIAN
- Sam Giffin, Director, Data Operations
- Adam Raimond, Construction Index Manager
WEBCOR
- Craig Blinston, Vice President, Estimating and Preconstruction SME
- Gordon Gangitano, Vice President, Webcor Builders
- Ryan Hoff, Sr. Preconstruction Director
- Todd Lamberty, Sr. Project Director, Webcor Drywall
- Allison McCue, Sr. Vice President, Project Planning, Webcor Builders
- Todd Mercer, Sr. Vice President, Webcor Builders
- Greg Miller, Sr. Vice President, Webcor Concrete
- Mitch Thomson, Project Director, Facades SME
Resources
Gordian 2023 webinar: https://www.gordian.com/resources/2023-construction-cost-trends/
Gordian Construction Dive, “Higher material prices here to stay.” June 2023:
https://www.constructiondive.com/news/falling-material-prices-expected-reverse-course/651744/2024
RSMeans Data Unveiled: https://www.gordian.com/resources/2024-rsmeans-data-unveiled/
Share this:


