

Construction Cost Insights Report: Q3 2023

Executive Summary
Over the past few years, construction material prices have seen significant fluctuations — ups, downs, twists and turns — with some material prices spiking while others tumble. In a year-over-year summary (2022-2023), Gordian determined that 82% of materials experienced a significant increase, climbing 19% on average. Material prices have been influenced by various factors, such as changes in tariffs and production costs, including increased wages, labor shortage, global economic conditions, and supply and demand, especially during the height of the pandemic. Overall, these recent years have been characterized by a volatile market for building and construction materials, and AEC professionals and real estate developers need to stay up-to-date with market trends and pricing changes to make informed decisions about their projects.
The good news looking forward: It appears this multiyear rollercoaster ride is starting to stabilize and the rollercoaster is slowing down, although uncertainty continues to loom. In times of uncertainty, knowledge is our best defense.
Here, some top industry experts explain the myriad conditions and trends impacting construction material pricing:
Jay Pendergrass, Vice President, Director, Supply Chain Management & Equipment for Gilbane, cites tight labor markets and high inflation for keeping wages on the upside. He says, “Demand for workers exceeds labor supply currently, although conditions appear to be improving. Production wages are increasing costs for finished products, increasing the cost of goods.”
He further mentions that the disruptions in logistics have mostly subsided, although there are still some ongoing problems with labor, particularly on the West Coast. The backlogs of various commodities, equipment, and materials are diminishing, leading to shorter delivery times. Pendergrass adds that the construction demand for the near future seems to be stable, and although the prices for many materials have decreased, he believes in most cases it is unlikely that they will return to the levels seen in 2020.
Gordian Construction Index Manager Adam Raimond agrees, asserting that while there are a couple of item types (structural steel, etc.) where it’s trending downward closer to pre-pandemic levels, it doesn’t appear they are on a trajectory to hit those old prices anytime soon. He says, “I’d more likely expect prices to flatten or creep slowly upward again over time because demand for these materials is not subsiding.”
In general, the broad indices for construction materials reveal price stabilization in 2023, but it is important to note that individual products may experience significant variations. Mark Duda, Senior Preconstruction Director at McCarthy Building Companies, explains, for example, that lumber, steel pipe and aluminum prices have seen double-digit decreases over the past 12 months. On the contrary, concrete, glass, gypsum, and insulation have witnessed double-digit price increases during the same time period. To deal with these variables, he stresses that maintaining consistent communication with suppliers remains crucial to ensure precise cost estimations.
Raimond concurs, sharing that Gordian’s RSMeans Data is showing the same trends, adding asphalt to the list of upward movers, while Duda notes that although pricing trends can still vary greatly from product to product, the industry is starting to see lead times for structural and architectural components—such as structural steel and roofing insulation— return to normal.
Tim Jed, Supply Chain Leader at DPR Construction, agrees that overall material prices are leveling off, with some variation based on factors such as raw material costs, geopolitical and weather-related events, which, he explains, can cause spikes in prices. He notes, for instance, that there has been a consistent increase in concrete prices, as well as HVAC equipment prices, over the past three years. On the other hand, the prices of lumber and plywood are gradually approaching the levels seen before the COVID-19 pandemic.
In terms of general challenges, he adds, one of the primary concerns is the extended lead times for certain materials, particularly electrical materials, which, Jed explains, is being driven by high demand and pre-purchase for green initiatives like the electric vehicle (EV) and certain solar products legislation.
Building Models Used To Calculate Price Data
Gordian’s data team researches material, labor and equipment prices and quantities in cities across the U.S. and Canada to create a composite cost model, which is weighted to reflect actual usage in the building construction industry. To capture the types of construction activity typically performed across North America, researchers merged nine building types, which represent those most commonly found across America and Canada. They are:
1. FACTORY (one story)
2. OFFICE (two to four stories)
3. STORE (retail)
4. TOWN HALL (two to three stories)
5. HIGH SCHOOL (two to three stories)
6. HOSPITAL (four to eight stories)
7. GARAGE (parking)
8. APARTMENT (one to three stories)
9. HOTEL/MOTEL (two to three stories)
Leading firms are incorporating creative responses related to building product supply chain issues and/or budgeting and estimating materials costs.
Gilbane, for instance, has engaged teams to work collaboratively with clients to use “off-the-shelf” modular equipment on custom skids to help mitigate onsite labor shortage and supply chain impacts. Pendergrass shares, “Prefabricated components and systems such as energy recovery skids, heat pump enclosures, switchgear, and generators limit the possible points of schedule failure on projects. The availability of procuring custom components such as printed circuit boards (PCB) and electronic control/ commutated motors (ECM) for customized systems was a manageable risk in pre-COVID-times.”
Additionally, he suggests that custom assemblies can present more challenges due to the pressures on the supply chain. To mitigate these issues, plug-and-play systems and components have demonstrated greater efficiency considering current constraints. While this strategy does involve design considerations, the principle of prioritizing the certainty of achieving desired outcomes, rather than the optimization of systems, tends to be more acceptable to stakeholders overall.
DPR, too, has recently introduced a comprehensive program aimed at enhancing supplier relationships wherein internal teams are actively engaged in conducting interviews and surveys, gathering and storing data on pricing and lead time costs. This includes analyzing future projections. Additionally, according to Jed, they have compiled an extensive database of 24,000 searchable updates on product prices and lead times from various manufacturers. The resources are readily accessible to DPR’s internal teams, enabling them to gain valuable insights into emerging trends and potential challenges ahead.
Duda explains that McCarthy has created a national committee focused on market conditions and pricing escalation. “It’s a great environment to discuss challenges in our different regions and share best practices to mitigate issues,” he says, adding, “The committee is currently working on a dashboard that will provide real-time pricing trends to all of our building teams across the country.”
How National Average Material Costs Are Determined
Gordian’s team contacts manufacturers, dealers, distributors, and contractors all across the U.S. and Canada to determine national average material costs. Included within material costs are fasteners for a normal installation. Gordian’s engineers use manufacturers’ recommendations, written specifications, and/or standard construction practice for size and spacing of fasteners. The manufacturer’s warranty is assumed. Extended warranties and sales tax are not included in the material costs.
Note: Adjustments to material costs may be required for your specific application or location. If you have access to current material costs for your specific location, you may wish to make adjustments to reflect differences from the national average.
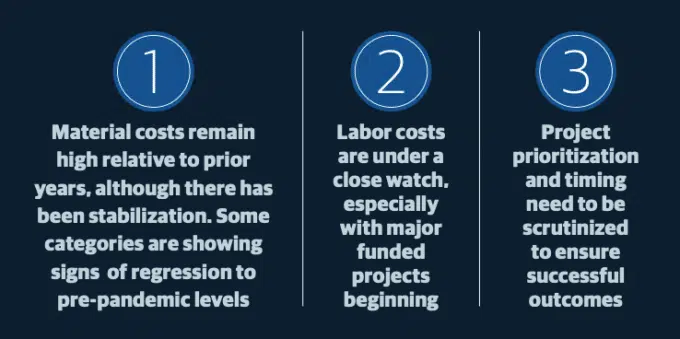
As to building product costs and supply chain health for the near future, industry experts are expressing cautious optimism that material pricing will continue to stabilize for the rest of 2023 with a few caveats. McCarthy’s Mark Duda advises, for example, that labor shortage and a bustling market can frequently counterbalance any savings achieved through stable material pricing.
Jed from DPR shares this sentiment, stating that most prices are expected to remain relatively calm in 2023, but regionalized cost pressures and increases are anticipated to emerge in 2024. These factors will be driven by the demand for infrastructure projects and large-scale endeavors such as data centers and semiconductor plants, which will tie up future supply.
Gilbane’s Pendergrass adds that the next six to 10 months will be an inflection point for electrical and mechanical categories to resolve the current production backlog issues and sub-supplier delays, but future demand will also impact their availability. He further predicts that inflation will slow over the next six months, but price declines may not be felt before 2024.
Building upon the previous discussion, it is expected that nearly every material category will reach a “normal” rate of price change in 2024. Many items have already reached a point where their prices are experiencing little variation within a three- to six-month period compared to 2022.
However, Gordian’s Raimond notes that exceptions to this trend include concrete and gypsum, which continue to witness increases, and lumber, which either remains stable or experiences decreases, depending on the region.
Observing the pricing trends for raw, heavy materials, it becomes apparent that regional cost pressures continue to play a significant role. Concrete, gypsum, and asphalt are particularly affected. The transportation costs associated with these commodities, due to their weight and specific production locations, contribute to higher prices in certain regions compared to others.
Experts from Gordian echo these findings. Construction Dive recently published their insights, stating that although the industry is currently experiencing a downturn from the historic pricing peaks of 2022, increasing demand for construction will likely sustain materials and labor pricing through 2024 and 2025. Sam Giffin, Director of Data Operations at Gordian, remarked that while concrete is projected to decrease by 1% to 2% annually until 2025, materials like wood, plastics, composites, plaster, gypsum, and thermal protection are expected to see average annual increases of up to 6.5% during the same period.
In This First Quarterly Construction Insights Report:
In this first Quarterly Construction Cost Insights Report, we will be examining key data points surrounding construction material pricing. We will look at the historical cost index, offering a retrospective lens on pricing trends, and the city cost index, providing a granular view of localized market variations. In addition, we will thoroughly explore the pricing trends of six key building materials:
• STRUCTURAL STEEL
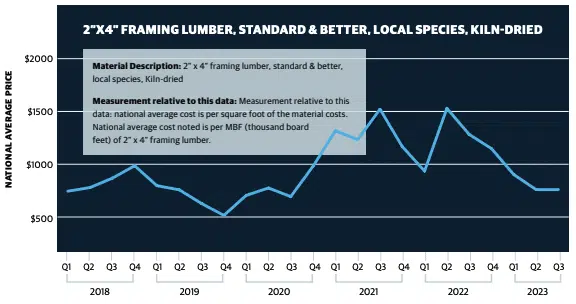
• FRAMING LUMBER
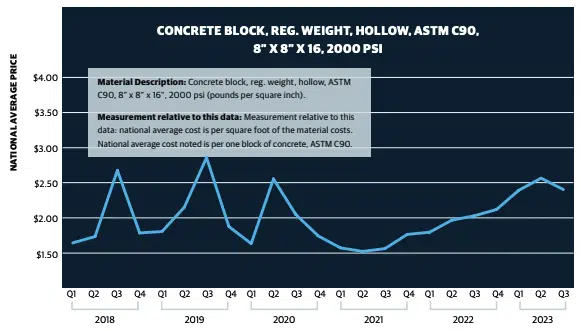
• CONCRETE BLOCK
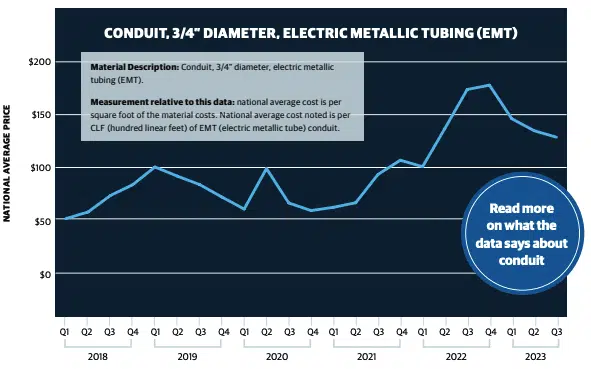
• CONDUIT
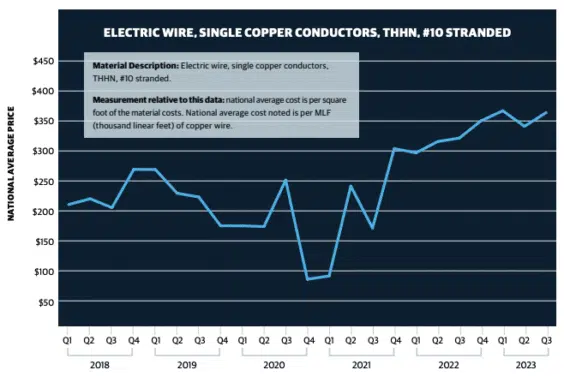
• COPPER ELECTRIC WIRE
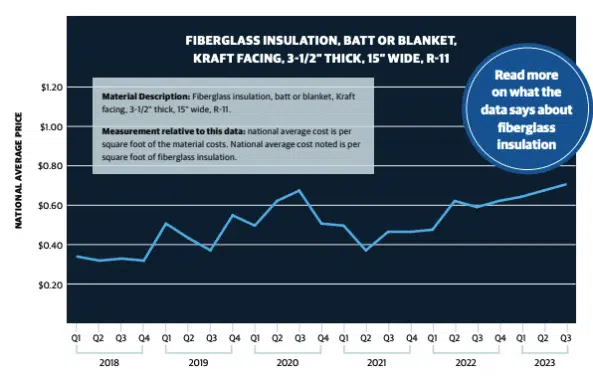
• FIBERGLASS INSULATION
Industry experts remain cautiously optimistic about the stabilization of construction material pricing for the remainder of 2023. However, the challenges posed by labor shortage and a bustling market might offset potential savings in material costs. Looking ahead, the consensus suggests that while prices are expected to remain relatively calm this year, regionalized cost pressures and increases may emerge in 2024 due to infrastructure and large-scale project demands. While inflation is predicted to decrease in the coming months, the actual decline in prices might not be noticeable until 2024. Ultimately, the industry anticipates a return to a more predictable pricing landscape, with a majority of materials experiencing a yearly price change of less than 5%.
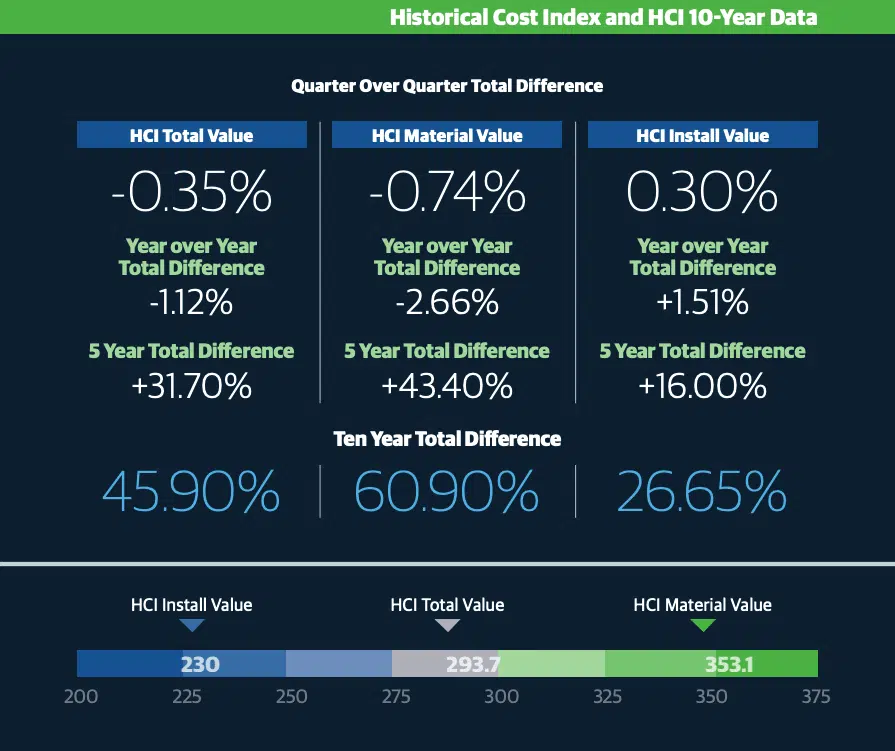
The HCI (Historical Cost Index) is an invaluable tool to track changes in the cost of construction materials and labor over time. The HCI Total Index Value represents the overall change in construction costs, including materials, labor, and installation expenses. The HCI Material Value tracks the change in the cost of raw materials, such as lumber and steel. The HCI Install Value measures the change in the cost of installation labor, including plumbing, electrical, and HVAC. These indices provide valuable insights, helping building industry professionals to anticipate and plan for changes in construction costs and make informed decisions about project budgets and timelines.
NOTES:
• The index values are based on a 30-city national average with a base of 100 on January 1, 1993. The three numbers are the total, material, and install index numbers, respectively, for the 30-city national average in 2023.
• The Historical Cost Index (HCI) applies the quarterly City Cost Index (CCI) updates to a historical benchmark and allows specific locations to be indexed over time. These indexes with RSMeans Data are a vital tool for forecasting construction costs and can be a valuable source of information for comparing, updating, and forecasting construction costs throughout the United States.
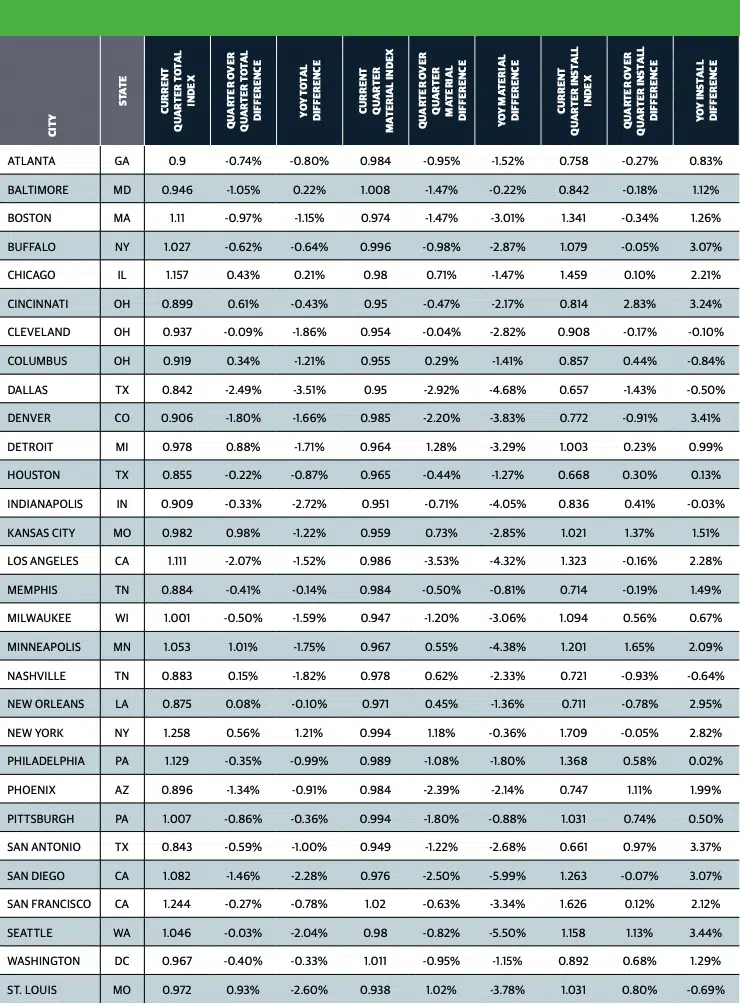
The City Cost Index is a quarterly data product designed to answer the question, “How much higher/lower are costs in my city relative to the national average?” The CCI can be used to better reflect localized pricing in construction estimates. Each quarter, Gordian’s RSMeans Data research team collects prices from cities across the United States and Canada, which are then compared to the national average and the current year’s annual release data to create the CCI. The City Cost Index shows a factor for Material, Installation and Total with rows representing multiple CCI divisions. Additionally, the CCI shows a Material Total, Installation Total and a Total Weighted Average.
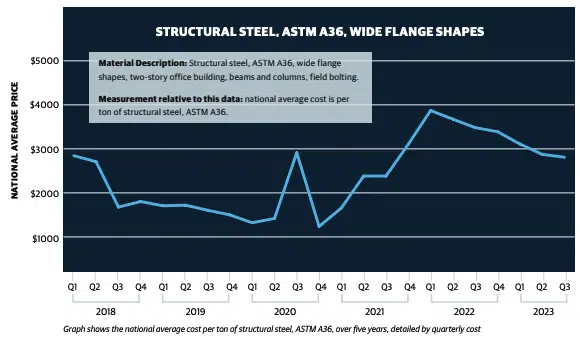
What the data says:
• Steady increases from 2021 continued through 2022
• Cost acceleration in late 2022 Q1/Q2 due to supply chain constraints
• Cost stabilizations/decrease continued into 2023 Q1/Q2/Q3
Read more on what the data says about steel
View from the field:
 Jay Pendergrass (Gilbane): “There are no substantial supply issues with structural steel currently; pricing is decreasing as well. Construction future demand is still high, so future stabilization level remains somewhat uncertain.”
 Tim Jed (DPR): “Steel is up significantly pre-COVID but has had recent downward movement with minor recent increases, and it is available within normal lead times.”
 Mark Duda (McCarthy): “We are starting to see lead times for structural and architectural components return to normal. Some examples [include] structural steel.”
Focus on Structural Steel
There has been a ton of uncertainty in metals markets throughout the last year or so. Gordian’s experts note that early in 2022, there were massive steel and aluminum cost increases as production ramped up to try to get
back to pre-COVID levels. Then inflation, supply chain issues like trucking shortages and international affairs
simultaneously added to the rising steel costs. The invasion of Ukraine by Russia, for example, shocked the
metals market around the world and led to a decline of steel exports from the region. All these factors combined
to incrementally increase structural steel costs over 200% in just over two years’ time.
Thankfully, during the latter months of 2022, U.S. mill prices declined, an indication that production was starting to catch up to demand. That trend is continuing into 2023, as costs stabilize. After structural steel costs increased 268% from the last quarter of 2020 and hit a high point last year, they have been on a steady decline. Over the past three quarters, structural steel costs have decreased
35%, providing some relief to project owners.
What are the industry ramifications?
A wide range of engineers, architects, estimators, contractors and facility owners depend on accurate construction cost data to plan new building construction and renovation projects. Looking at these steel material cost trend lines, these professionals should be on guard for more price fluctuation in 2023. Steel uses in six primary market sectors are driving demand. These industries and applications include construction and
infrastructure, mechanical equipment, automotive and transportation, consumer products, industrial and
commercial appliances and machinery, and electrical equipment. Building construction and infrastructure is the
single largest market for steel use.
What the data says:
• 2023 lumber prices declined after climbs since 2020
• Typical season peak observed in 2022 Q2
• Pricing stabilization/decrease seen in 2023 Q2/Q3
Read more on what the data says about lumber
View from the field:
Jay Pendergrass (Gilbane): “Currently, there are no supply chain issues to report, and costs have retreated substantially back to 2020-2021 levels. However, given the extensive wildfires in Canada, future supply could be compromised.”
Tim Jed (DPR): “Lumber and plywood are beginning to approach pre-COVID level and are readily available.”
What the data says:
• High price increases through most of 2022 driven by supply constraints
• 2023 Q2 rose but at a lower rate than Q1; Q3 saw a slight decline
View from the field:
Jay Pendergrass (Gilbane): “We aren’t seeing any delays with concrete block; delivery for specialty colors may be slowed.”
 Adam Raimond (Gordian): “The increases are continuing because the ingredients that go into ready-mix concrete like sand and limestone are facing a global shortage. Sand, in particular, was having shortages reported upon even pre-pandemic. For limestone, there was a quarry closure in Mexico last year, and the gap from its closure hasn’t been filled. Since these problems have been occurring for a while, it’s unlikely that a solution will be found in the near future, so continued price increases are expected.”
What the data says:
• Significant escalations in 2022 Q2 – Q4 driven by international supply chain
• 2023 prices slowly coming down from 2022 highs
View from the field:
Tim Jed (DPR): “Lead times have normalized, and we’ve received information that pricing, while higher than pre-pandemic, has leveled off from some providers, with others asking for increases.”
What the data says:
• Significant escalations in 2022 Q2 – Q4 driven by international supply chain
• Copper price increases continuing into 2023
View from the field:
Jay Pendergrass (Gilbane): “Division 26 supply chain is constrained, particularly switch gear, generators,transformers, and any custom electrical equipment or electronic controllers. Production issues and supply chain
have been impacted by the CHIPS Act and recent investments in the blue economy.”
Tim Jed (DPR): “Medium voltage copper wire is down slightly in price, but lead times remain high, from 30 to 60 weeks depending on manufacturer, due to grid/green initiatives … and future demand they create.”
What the data says:
• Supply shortages drove up prices in 2022 Q1 after two years of decline
• Prices holding at these higher levels in 2023 Q1, Q2 and Q3
View from the field:
Tim Jed (DPR): “Pricing is significantly higher than pre-pandemic but leveling off with some indication of pending increases soon. Some materials/manufacturers are on allocation.”
Resources
Gordian 2023 webinar: https://www.gordian.com/resources/2023-construction-cost-trends/
Gordian material data blog series: https://www.gordian.com/blog/?topic%5B%5D=trends-and-insights
Gordian Construction Dive, “Higher material prices here to stay.” June 2023:
https://www.constructiondive.com/news/falling-material-prices-expected-reverse-course/651744/
Share this: